In September, when the Supreme Court issued an order granting review in State v. Salinas (2013AP2686), readers who turned to the second page were likely surprised by an unusual comment added by Justice Abrahamson, who expressed apprehension over the state of affairs on two fronts: (1) the number of cases on the court’s calendar for the 2015-16 term; and (2) the percentage of these cases that presented unpublished decisions from the court of appeals.
Justice Abrahamson’s unease invites scrutiny of various sorts—one being the question of whether these developments represent departures from the court’s practice in previous terms. Here is ground on which SCOWstats may be of service, for we can compare figures for 2015-16 with data from the previous twenty terms and determine to what extent, if any, 2015-16 marks a departure from the norm established over the last two decades.
The Supreme Court customarily holds a petitions conference once a month, as it did on October 7, where the justices decide which cases to accept for review. Given that the next conference does not appear on their calendar until the following month, October will be our cut-off point for each of the twenty terms to be compared to 2015-16. In other words, I will examine the cases decided in each of the previous terms and isolate just those that had been accepted for review by the end of October of the term in question.[1] These cases can then be compared to the cases on the Supreme Court’s docket so far in 2015-16, allowing us to determine whether the current term is unusual regarding the points raised by Justice Abrahamson.
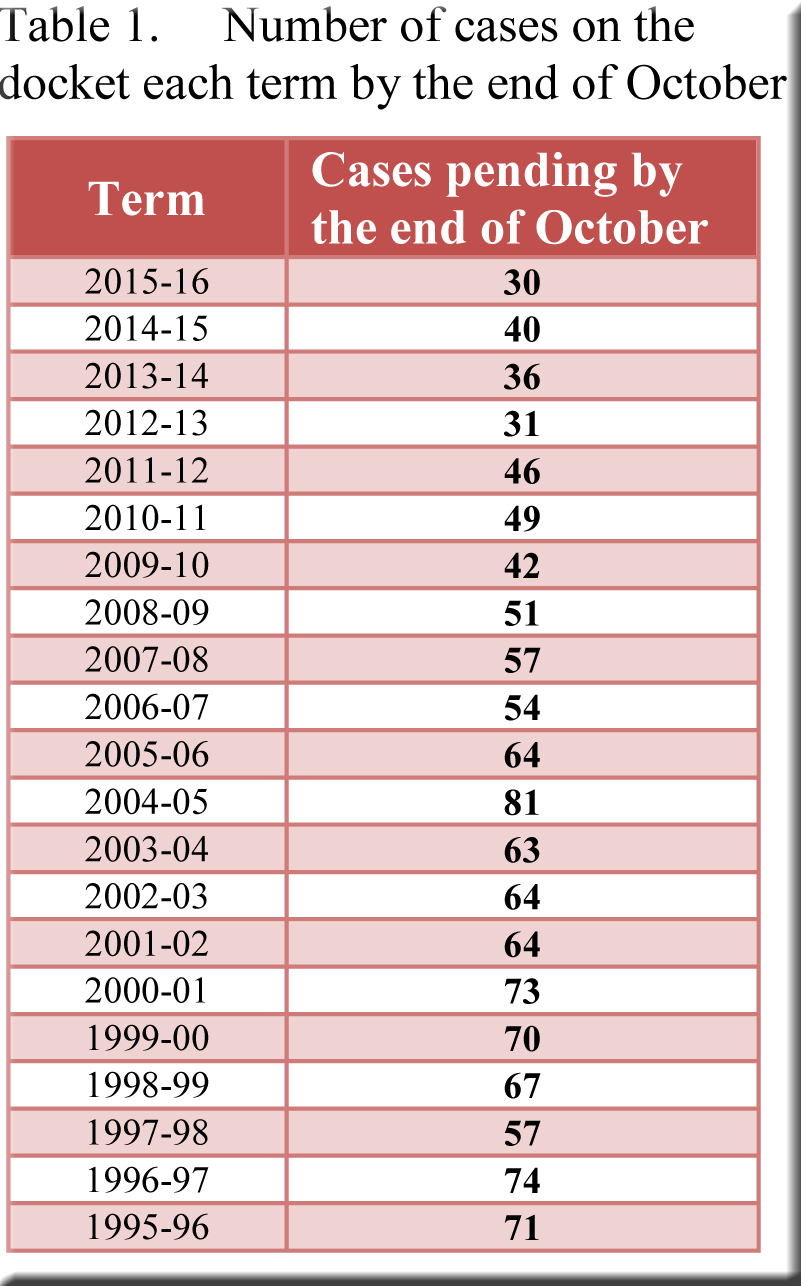
First, let’s take the matter of the number of cases in the pipeline, which prompted Justice Abrahamson to worry that “[o]ur November oral argument calendar has only one case scheduled. The possibility exists that no cases will be ready for the December oral argument calendar.” As shown in Table 1 the court now has 30 cases pending, at various stages on the road to a decision.[2] This is indeed fewer than the number for any of the preceding twenty terms in the table—and well below the twenty-term average of 58 cases that had been accepted for review no later than the end of October. For the period 2008-09 through 2014-15 (during which the same seven justices served on the court), the average was 42 cases, and it was 66 cases over the thirteen terms before that (1995-96 through 2007-08). The 2012-13 term, when only 31 cases were pending by the end of October, is the closest match in this regard to 2015-16. As it turned out, when the 2012-13 term came to an end, the justices had decided only 46 cases, the lowest total in the twenty-year period.[3] Next summer, it will be interesting to see how the final total for 2015-16 compares.
Justice Abrahamson also voiced misgivings over the acceptance for review of unpublished court of appeals decisions. She felt that they represented far too large a share of the cases on the court’s calendar, and she seemed especially troubled by what she regarded as an excessively high number of per curiam decisions from the court of appeals. One can infer that she deems at least some of these cases as undeserving of review, for she made a point of quoting from the “Wisconsin Court of Appeals Internal Operating Procedures” to observe that per curiam decisions “do not involve ‘new or unsettled questions of general importance.’”
So, how does 2015-16 compare with previous terms regarding per curiam decisions from the court of appeals? Table 2 indicates that, through the end of October, per curiam decisions represented a larger share (27%) of the cases on the court’s calendar in 2015-16 than for any individual term in the preceding twenty years. Viewing these twenty years as a whole, we find that per curiam decisions accounted on average for only 9% of the cases on the court’s docket by the end of October. For the earliest thirteen years under consideration (1995-96 through 2007-08), the average was slightly lower—7.7% of cases had been per curiam decisions at the court of appeals—before climbing to 12.5% during the period 2008-09 through 2014-15.[4]

(Click here for a table that contains several additional columns, including one showing the percentage of cases accounted for by published decisions from the court of appeals—only 33% of all cases accepted for review in 2015-16, compared to an average of 51% of cases accepted for review during the preceding twenty terms.)
To be sure, questions remain that elude statistical resolution. For instance, opinions will vary over the extent to which one should be disturbed by the unusually small number of petitions granted and the substantial percentage of court of appeals per curiam decisions on the Supreme Court’s docket. One might also wonder why these differences with past averages are occurring in 2015-16. At the end of her comment on the order granting review in Salinas (itself a per curiam decision from the court of appeals), Justice Abrahamson suggested indirectly, by means of a quotation from Michael Heffernan’s Appellate Practice and Procedure in Wisconsin, that the Supreme Court, after rejecting too many worthy cases in previous months, might now be scrambling to bulk up its undernourished calendar with cases that do not always warrant such attention. Whatever the merits of this explanation, however, it leaves open the question of why so few petitions for review were granted in the months prior to September. This, after all, is what led to the shortage that now worries Justice Abrahamson.
Perhaps the meager harvest derives from recent turmoil on the court, though there may well be other plausible explanations. I would be grateful to benefit from knowledgeable readers who can speculate on reasons for the small number of cases, the large share of per curiam decisions—and how much cause for concern exists on either of these counts.
[1] This information is available on the court system’s website.
[2] This includes cases awaiting decision, awaiting oral argument, or still in the briefing stage. There is a slight chance that no decision will be issued for one or another of these cases during the 2015-16 term, but this possibility is sufficiently remote (especially for multiple cases) that it does not imperil the general findings that follow.
[3] Data for 2012-13 is available on SCOWstats.
[4] The averages are weighted in order to account for the varying number of cases on the court’s calendar from one year to the next.