Efforts to measure the influence of individual justices have employed a variety of methods over the years. Ranging from simple calculations of the frequency with which justices appear in majorities to the number of law review citations of their opinions, these techniques all reveal significant information. They also have limitations. Regarding law-review citations, for instance, longevity alone often accounts for much of a justice’s total. More importantly, these totals do not differentiate between a trivial note and an extended discussion—to say nothing of positive, negative, or neutral characterizations of a justice’s work. As for frequency in majorities, such percentages distinguish little between members of a bloc who almost always vote together (a common phenomenon in recent years). So, let’s enlist artificial intelligence—Anthropic’s Claude—and see how it copes with the challenge of gauging a justice’s clout.
The approach
I provided Claude with data for the 2023-24 and 2024-25 terms (when the court’s membership did not change) and asked it to create a means for comparing the influence of individual justices. In response, Claude calculated for each justice a score combining four metrics, weighted according to the proportions shown below.[1]
Metric 1 — Majority Opinion Writing Rate (35% of the composite score)
The number of majority opinions written by a justice as a share of all decisions in which the justice participated.
Metric 2 — Total Opinion Writing Rate (20%)
The number of all opinions—majority opinions, concurrences, and dissents—written by a justice as a share of all decisions in which the justice participated.
Metric 3 — Overall Win Rate (20%)
The frequency with which a justice sided with the majority.
Metric 4 — Win Rate in 4-3 Cases (25%)
The frequency with which a justice sided with the majority in 4-3 decisions.
The result
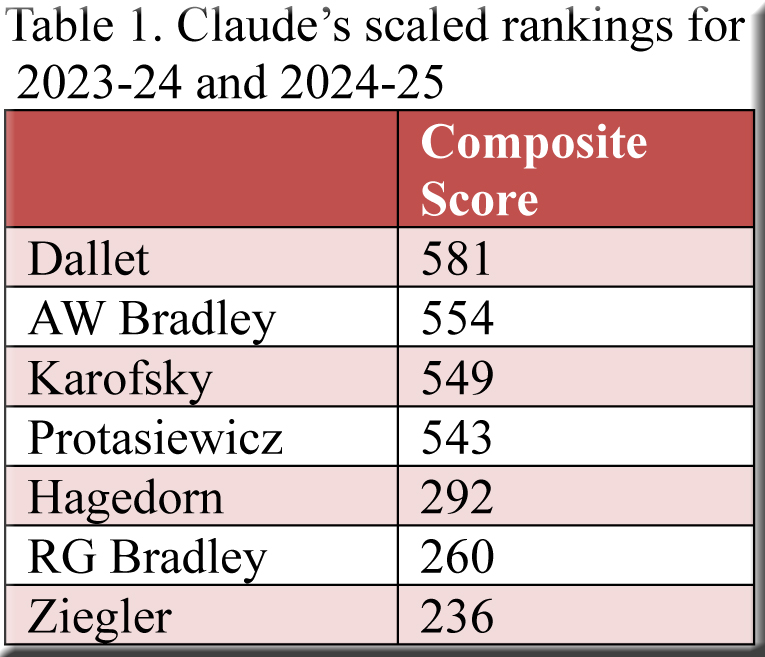
Upon crunching the numbers, Claude ranked Justice Dallet as the most influential member of the court during the last two terms, as displayed in Table 1.[2] She surpassed Justices AW Bradley, Karofsky, and Protasiewicz in two of Claude’s metrics—majority opinions and total opinions—and held her own in the other two, thereby distinguishing herself from her three liberal colleagues clustered more closely together.
At the other end of the table, Justices RG Bradley and Ziegler topped Justice Hagedorn’s total-opinion rate, but his overall win rate and majority opinion rate exceeded theirs, thus accounting for his higher composite score.
2020-21 through 2022-23
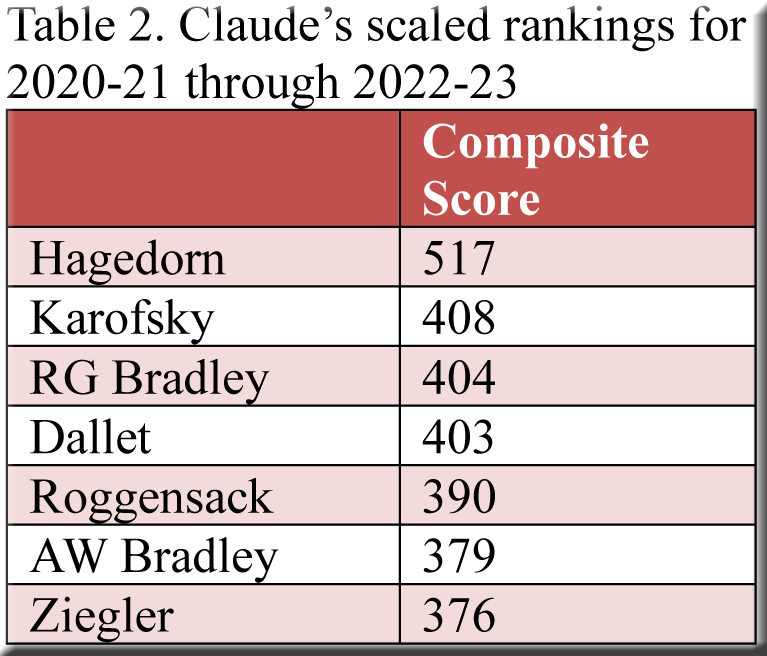
Claude’s approach underscores findings from previous posts that noted Justice Hagedorn’s outsized influence during the three terms when he served as a swing vote between the liberals (Justices AW Bradley, Dallet, and Karofsky) and conservatives (Justices Roggensack, Ziegler, and RG Bradley). Table 2 lists Claude’s rankings for these three years, and Justice Hagedorn does indeed occupy the top row. Not only that, the gulf separating him from the next justice (Karofsky) is enormous—109 points—82 points larger than the difference between Justices Dallet and AW Bradley in Table 1. In short, Justice Hagedorn thoroughly dominated Claude’s metrics, placing first in three categories: majority opinions, 4-3 wins, and overall wins.
It is also interesting that Justice Hagedorn’s liberal and conservative colleagues alternate row by row through the rest of the table and are huddled much more closely than the justices in Table 1. Only 32 points divide rows two through seven in Table 2, compared to 318 points in Table 1. In Claude’s view, the six justices in Table 2 are so tightly bunched in large measure because “their influence was ultimately constrained by which way Hagedorn voted on the cases that mattered most.”
2016-17 and 2017-18
After processing data from two of the years when conservatives controlled the court, it’s scarcely surprising to find Claude grading all five conservatives as more influential than the court’s two liberals, as detailed in Table 3. However, this table does contain some noteworthy elements. For one thing, no longer does a large gap separate rows one (Ziegler) and two (Gableman), as it did in Table 2 dominated by Justice Hagedorn.
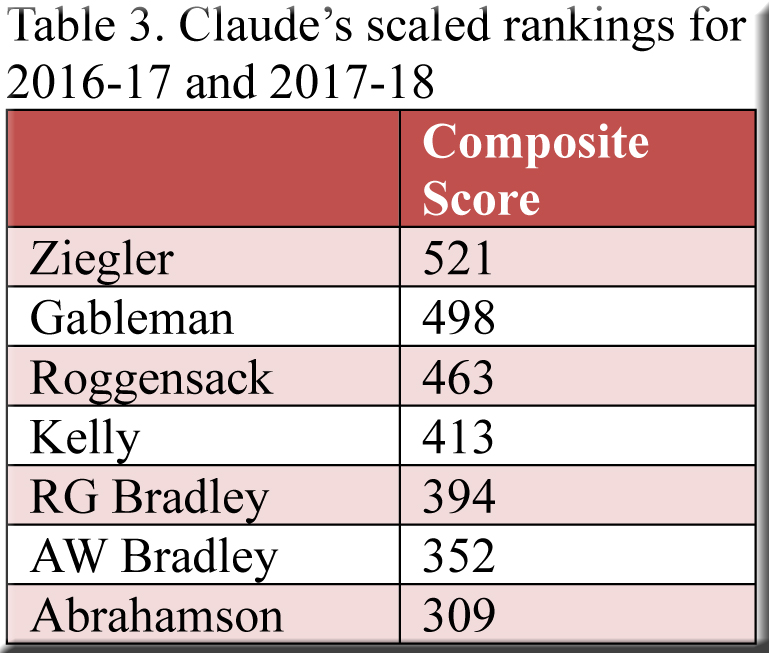
More significantly, a comparison of Table 1 and Table 3 illustrates how dramatically the court’s outlook has changed in under a decade. The conservative Justice Ziegler’s influence—number one by Claude’s reckoning in Table 3—plunged to row seven of Table 1, a drop of 285 points. Meanwhile, the influence of liberal Justice AW Bradley, moored near the bottom of Table 3, soared by 202 points as Claude promoted her all the way up to the second row of Table 1.
Not only have the liberals and conservatives switched positions in the two tables, their separation is now much greater. In Table 3, the gap between the “lowest” conservative (Justice RG Bradley) and the “highest” liberal (Justice AW Bradley) is remarkably small—only 42 points—and the average score for all five conservatives exceeds the average for the two liberals by only 127 points.
Compare this to Table 1, where the “lowest” liberal (Justice Protasiewicz) towers 283 points above the “highest” conservative (Justice RG Bradley)—a margin 241 points larger than the analogous gap in Table 3.[3] To a similarly conspicuous extent, the four liberals’ average score surpasses the average for conservatives RG Bradley and Ziegler by over 300 points. Even if Justice Hagedorn is also classified as a conservative (rather than, say, a swing vote) the liberals’ edge is still nearly 300 points.[4]
As always, AI output requires a cautious reception. I checked a few of Claude’s calculations “by hand” and found them accurate, but a more thorough inspection would be merited if the stakes were higher—and, of course, opinions may differ as to how much weight should be assigned to each metric (and whether other metrics deserve consideration).[5] However, if one regards Claude’s methodology as sound, it bolsters the supposition that conservative influence on the supreme court is now lower than at any point in contemporary memory.
[1] Here is Claude’s own explanation of its method:
“Metric 1 — Majority Opinion Writing Rate (35% of the composite score)
Writing the majority opinion is the single most powerful thing a justice can do. The majority opinion is the law — it sets the legal precedent, defines the reasoning, and shapes how courts and lawyers interpret the decision for years to come. A justice who writes more majority opinions is doing more to actually author the court’s output. I [Claude] calculated what share of each justice’s participated cases resulted in them writing the majority opinion.
Metric 2 — Total Opinion Writing Rate (20%)
Beyond majority opinions, justices can also write concurrences (agreeing with the outcome but for different reasons) and dissents (disagreeing and explaining why). Writing any opinion — even a losing one — is an act of intellectual leadership. It means the justice is actively shaping legal discourse, staking out positions, and potentially influencing future courts. I calculated what share of cases each justice produced some written opinion.
Metric 3 — Overall Win Rate (20%)
Quite simply: how often was the justice on the side that won? A justice who votes with the majority 100% of the time has voted to shape every single outcome the court produced. A justice who dissents half the time has been on the losing side of half the court’s decisions. This measures outcome influence — whose preferred result became the court’s result.
Metric 4 — Win Rate in 4-3 Cases (25%)
This is the most politically significant metric. When a case splits 4-3, every vote in the majority is essential — remove any one of those four justices’ votes and the decision flips. These are the cases where the court is most divided and the stakes of each individual vote are highest. A justice who is consistently in the 4-3 majority is a true swing or anchoring force. I looked at each justice’s record specifically in the eight 4-3 decisions across the two terms [referring to 2023-24 and 2024-25], asking how often they were part of the winning coalition.
The Composite Score
These four metrics are weighted and combined. Majority opinion writing gets the heaviest weight because it most directly determines legal precedent. The 4-3 win rate gets the second-highest weight because those cases are where individual judicial power is most concentrated. Overall win rate and total opinion writing each get equal, moderate weights.”
[2] Claude’s scores ranged between zero and one: 0.581 for Justice Dallet, 0.554 for Justice AW Bradley, and so forth. For the tables in this post, I multiplied each score by 1000, thereby scaling the results to remove the decimal points.
Incidentally, the result for Justice Dallet differs sharply from her ranking in a study of more limited scope confined to 2023-24.
[3] If we categorize Justice Hagedorn as a conservative, Justice’s Protasiewicz’s influence score still topped his by 251 points.
[4] The gap between the liberals’ average and that for Justices RG Bradley and Ziegler is 309 points. When Justice Hagedorn is added to the conservatives’ ranks, the gap becomes 294 points.
[5] One could also ask Gemini and ChatGPT to devise their own methods and compare their results with Claude’s. I would guess that the greatest similarity might occur at the top (and perhaps the bottom) of the tables.
While these are interesting statistics, they are not particularly meaningful. Those of us who regularly agrued before the court over the past ten years or more, paid close attention to the judges during oral arguments, and read the court’s decisions could have intuitively reached essentially the same conclusions without Claude’s help.
The more important question for Claude would be: how should attorneys fashion their arguments to increase their odds of success before the Wisconsin Supreme Court. It would be interesting to pose that question to lawyers who have practiced before the court and to Claude and see who does the best.
And don’t get me wrong: I’m sure Claude is a very nice guy.