As March is Women’s History Month, it seems an appropriate time to explore certain topics regarding female justices on America’s state supreme courts. We’ll begin with information from the National Center for State Courts, which describes the landscape in the spring/summer of 2015, and then compare these findings with impressions derived from scrutiny of the courts in all 50 states seven years later.[1] See whether you are more struck by the similarities or the differences between the snapshots from these two points in time.
Spring/Summer of 2015
According to the 2015 data, 36% of state supreme court justices were women—122 of 335—and women accounted for a slightly larger share, 40%, of the 52 chief justices.[2] (Oklahoma and Texas each have two courts of last resort, one for criminal and one for civil cases. Hence the total of 52 chief justices.)
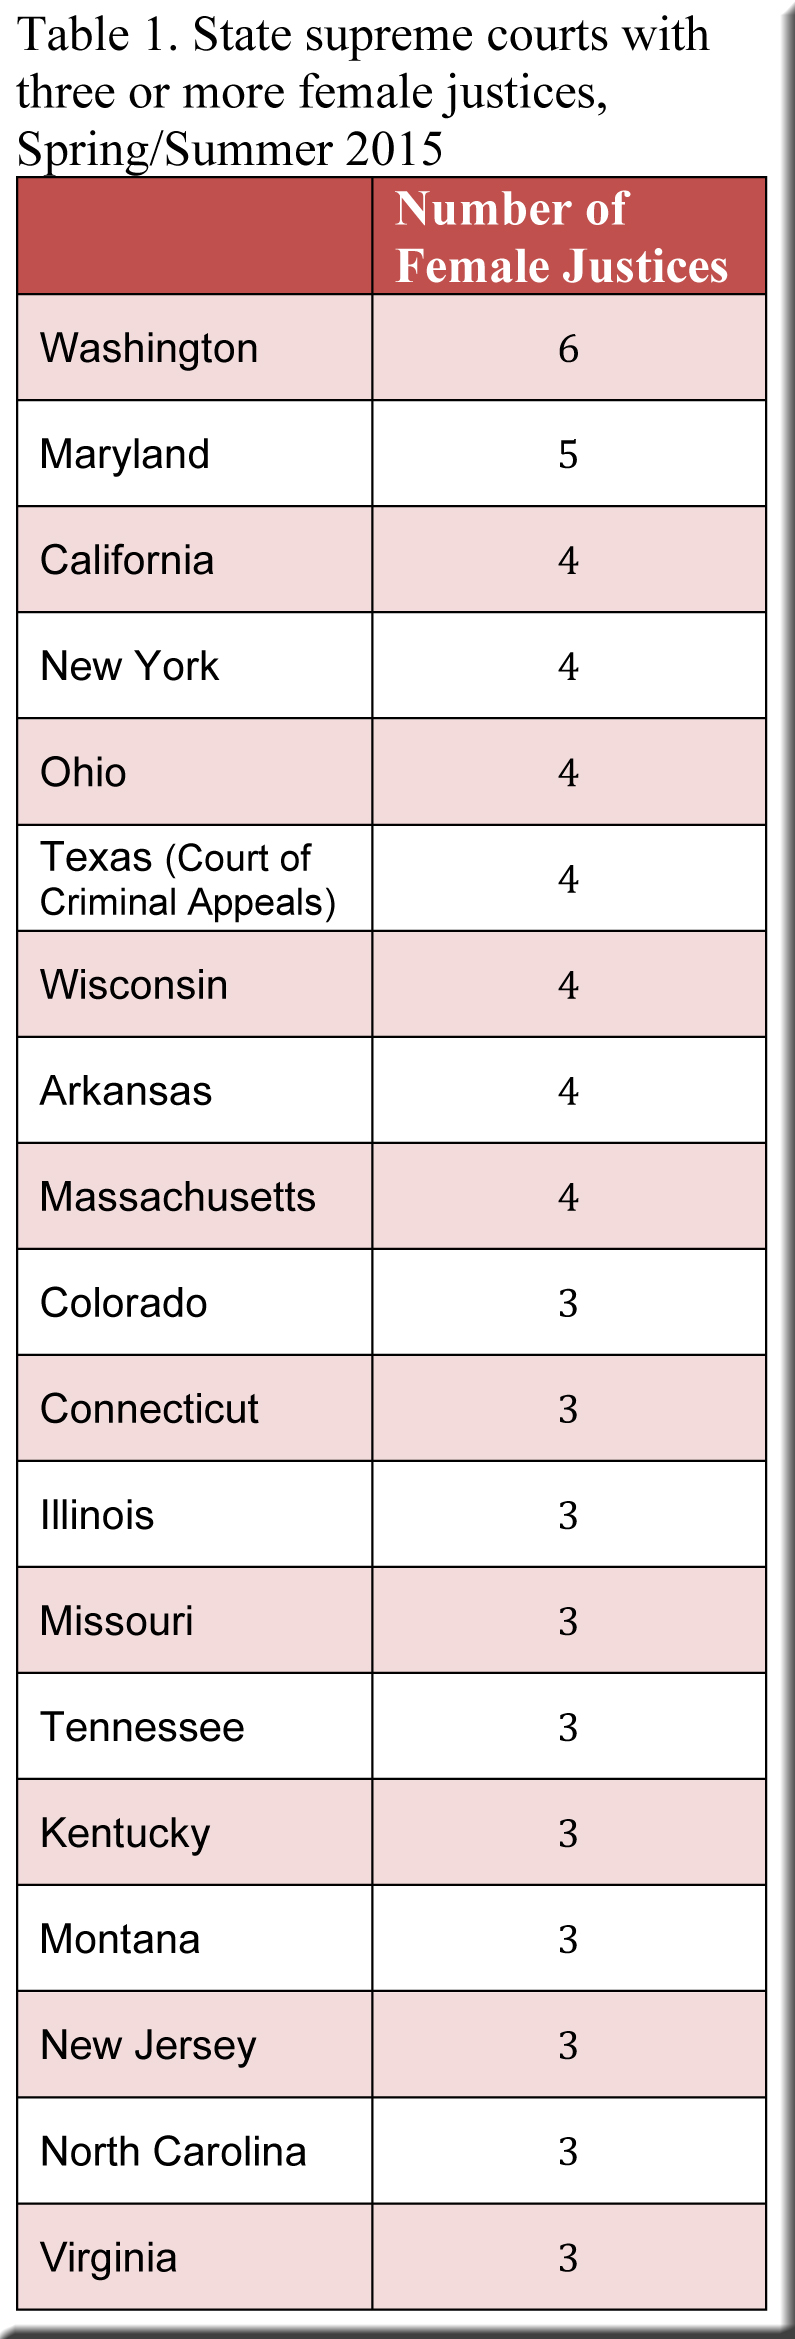
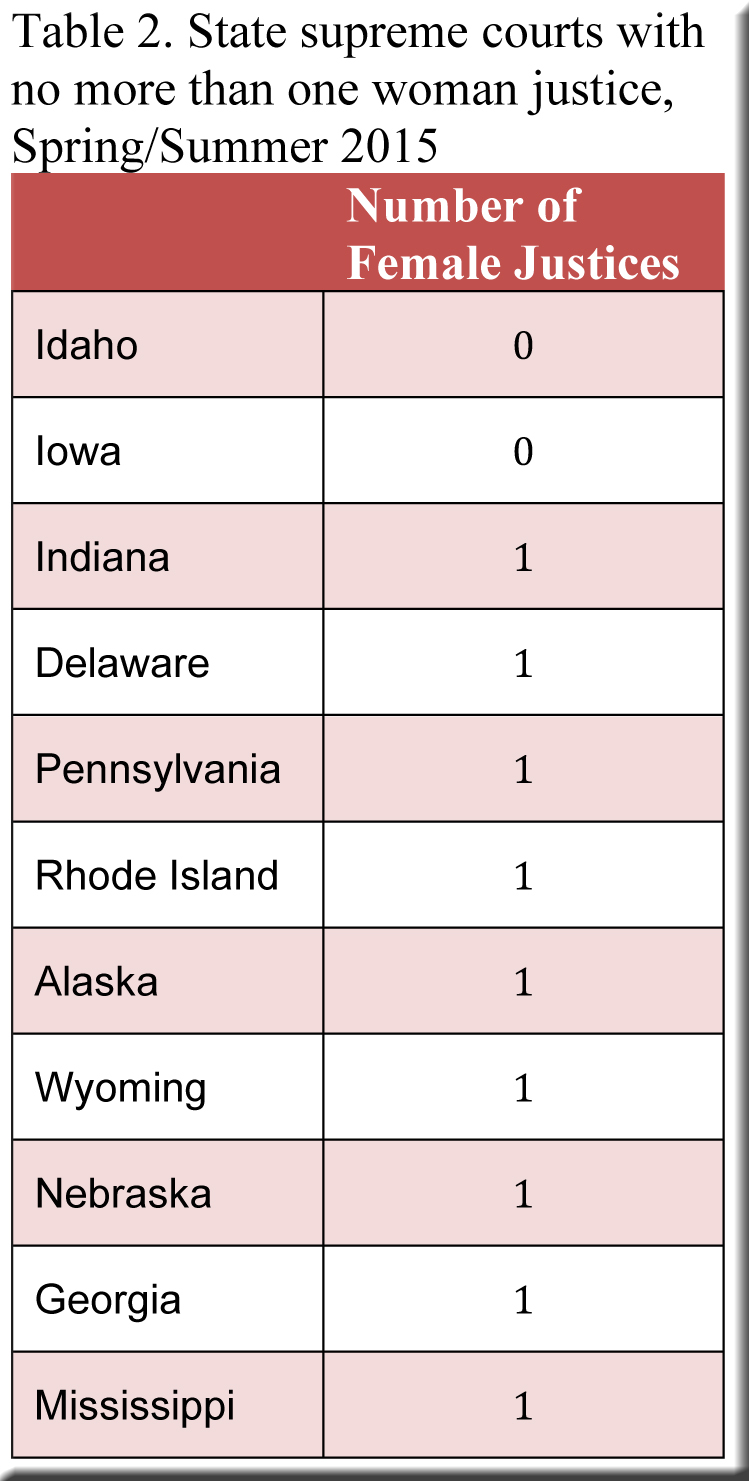
As one might expect, women were not distributed evenly among the 52 courts. Washington State had six female justices in 2015, for instance, and Maryland nearly matched that total with five—while neither Idaho nor Iowa had any. Table 1 displays the state supreme courts with at least three female justices, and Table 2 lists the states whose courts had no more than one.
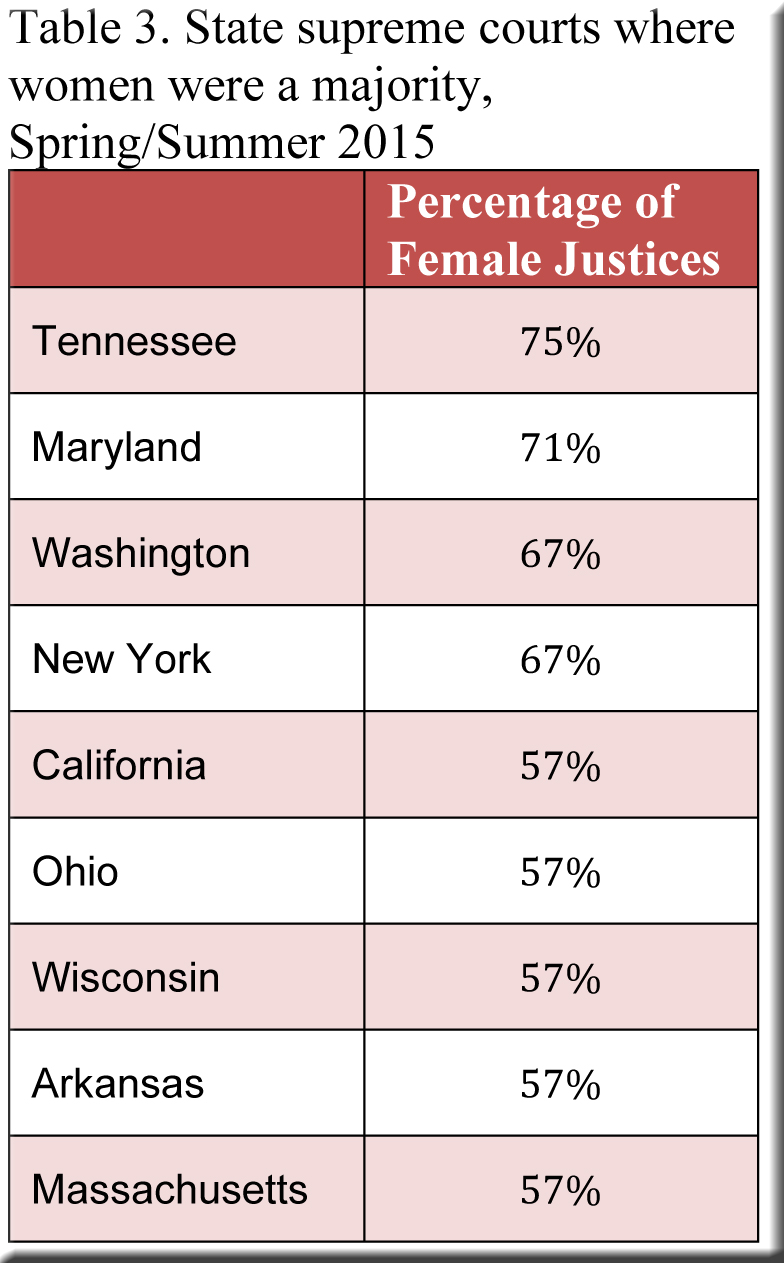
When determining which courts have the most female justices, it’s worth bearing in mind that the number of members on a court varies from state to state. A few courts seat nine justices; others seven; and some five. And, of course, a handful of spots will always be vacant at any given moment. Consequently, the presence of female justices might better be measured by calculating their percentage of a court’s roster, which will reveal the states where they represent the majority. Washington State still ranked high in 2015, as shown in Table 3, but because its court has nine members, its percentage of female justices slipped below that of Tennessee and Maryland.[3]
March of 2022
Now let’s compare the figures from 2015 with analogous information compiled seven years later. The percentage of female justices has increased—to 41% (138/340), up from 36% in 2015—but women’s share of chief justices dropped precipitously, from 40% in 2015 to 29% in 2022.
Washington State remained atop the list of courts with the largest number of female justices in 2022—presented below in Table 4—but none of the next six states in this table placed in the first six back in 2015 (Table 1).

Turning to the courts with the lowest numbers, we find that in both 2015 (Table 2) and 2022 (Table 5, below), there were 11 states with no more than one female justice. However, scarcely any of the states in Table 2 match those in Table 5—as only Indiana and Mississippi appear in both.

Finally, let’s have a look in Table 6 at those states where women formed a majority of a court’s justices in 2022. Here, we have a 44% increase over 2015, when only nine states made the list. Moreover, the current total of 13 states may soon move to 14, when California fills a vacancy for which Governor Gavin Newsom has nominated a woman.

[1] The NCSC data is said to have been updated last in February 2016. However, when I spot-checked the justices listed for the Wisconsin and Minnesota Supreme Courts, the lineups matched those of the justices on these two courts in the spring/summer of 2015 (and not during the 2015-16 term).
[2] I have omitted the District of Columbia. Also, six of 341 seats were temporarily vacant, leaving the total of 335 justices noted here.
[3] At the time, Tennessee had a vacancy along with four justices, and Maryland had seven justices.
Speak Your Mind