Using data from the just-completed 2018-19 term, we can update the findings for a number of significant topics that SCOWstats has been following for several years. There is much here to suggest greater efficiency at the supreme court in 2018-19—which, one could predict, would allow the justices to handle more cases than they did the previous term.
Frequency of Separate Opinions
Concurrences and dissents, generated by the justices at an unprecedented clip during the past few years, directly impact all of our other topics today, so let’s see what happened in 2018-19. In a nutshell (and in Table 1), the frequency of separate opinions peaked in 2015-16 and remained close to that mark the following year. Although the rate dropped substantially in 2017-18, it was still high by historic standards—until it plunged again in 2018-19 to an average of roughly one separate opinion per decision. We have to go back to 2011-12 in the table to encounter a similar rate, and it is very near the average (0.96) for the period from 1997-98 through 2011-12.[1]

The first post in this series noted the diminished activity of Justice Abrahamson, and this surely played a major role in shaping the table’s listing for 2018-19. During the preceding five years, for example, she averaged 23 separate opinions per term—more than any other justice—while in 2018-19 she authored only three.[2] Had she written her average number of separate opinions in 2018-19, the table’s figure for the last term would have been 1.35, the third-highest entry over the entire 22-year period. Next term, when she is no longer on the court, it will be interesting to see how many separate opinions the justices turn out.
Length of Decisions
The plummeting number of pages per decision over the last three terms may be the most striking feature in any of this post’s tables and graphs. After reaching a record high of 62 pages per decision in 2015-16, the average fell all the way to 37 pages by 2018-19 (see Graph 1), a reduction of fully 40% to a level not seen since the beginning of this century.[3]

As displayed in Table 2, concurrences and dissents were responsible for much of the decrease, with the average number of separate-opinion pages per decision shrinking by 33% in 2018-19.[4] This should occasion no surprise in view of the foregoing discussion on Justice Abrahamson and the dwindling number of separate opinions. Meanwhile, the average majority opinion also shed a few pages in 2018-19 and emerged lighter than in any other year covered by the table.[5]

Fractured Decisions
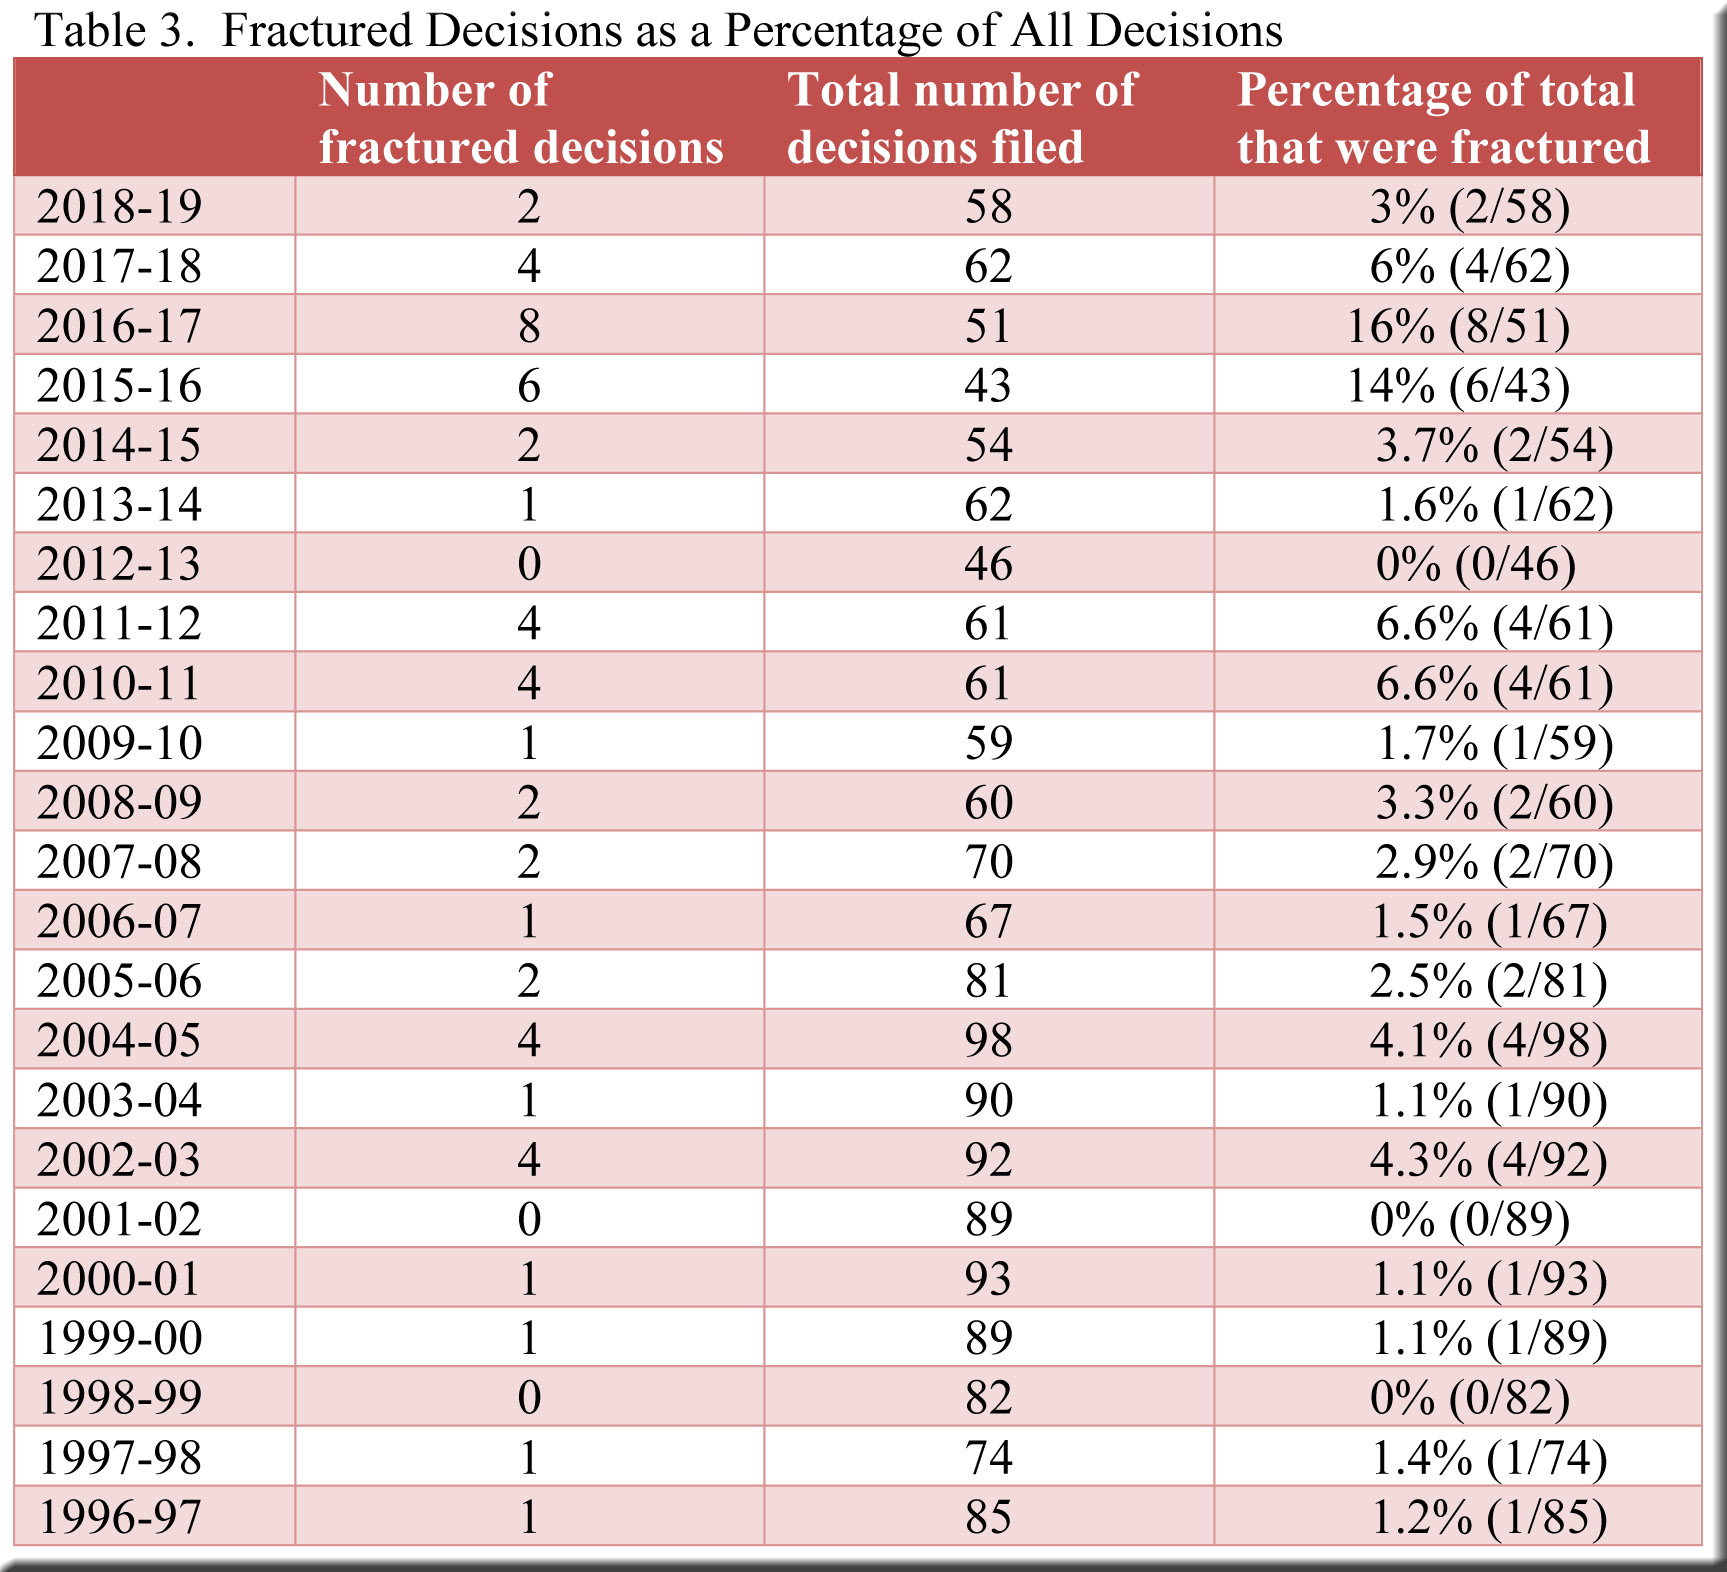
If, as I would guess, people in law firms and state agencies were generally grateful to receive more concise decisions from the court in 2018-19, they must have been pleased as well to discover fewer fractured decisions among these slimmer filings. Fractured decisions, in which fewer than four justices can agree on the reasoning for the court’s ruling, have no precedential value. Consequently, they can leave important issues unresolved and thereby require future parties to expend time and money relitigating the disputes. In the meantime, lower courts, attorneys, government officials and law enforcement are left in the dark regarding these points of law.
Happily, then, the frequency of fractured decisions—after reaching troubling levels in 2015-16 and the following term—declined over the next two terms to a rate of only 3% by 2018-19 (as shown in Table 3). This approaches the average of 2.3% for the period 1996-97 through 2014-15 and may suggest that the justices have put the problem behind them.[6]
Time Between Oral Argument and Decision Filing
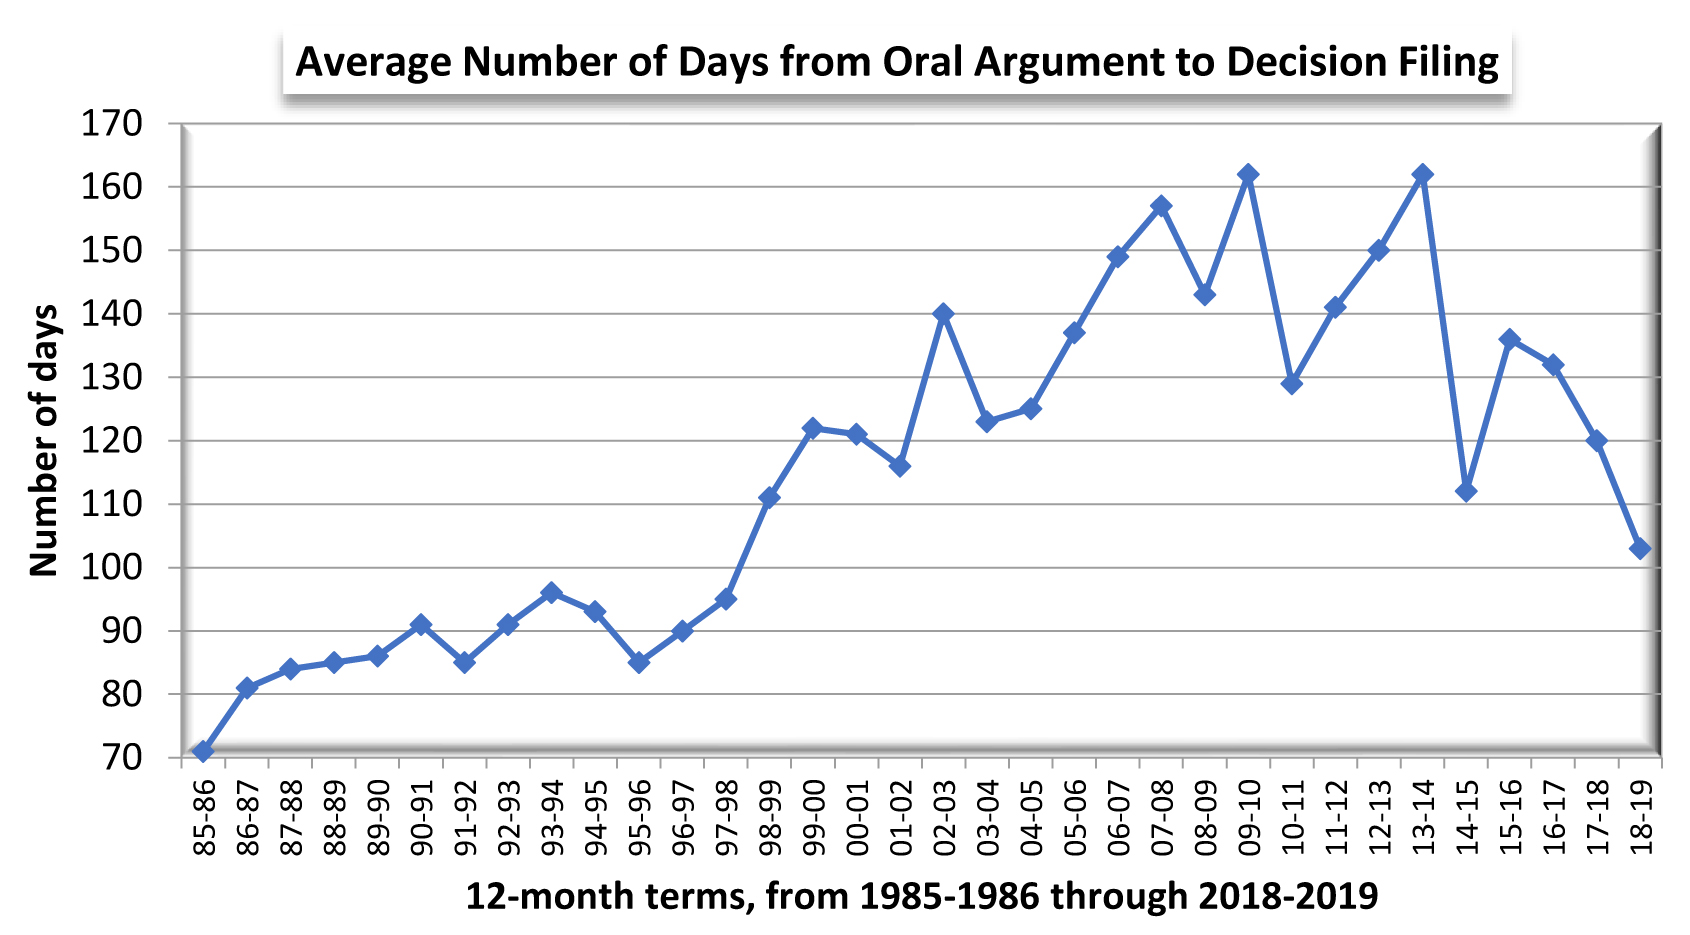
Given the findings in the three categories above—fewer separate opinions, fewer pages per decision, and fewer fractured decisions—one might foresee that the justices would file decisions more quickly—and so they did (Graph 2). Indeed, only 103 days elapsed, on average, between oral argument and decision filing in 2018-19, a shorter period than at any time since 1997-98.[7]
Justices A.W. Bradley and Kelly chopped the most days off their averages (Table 4), but this was a collective accomplishment. All of the justices required less time to file their decisions in 2018-19 than in the previous term (not counting, of course, newcomer Justice Dallet).

A Puzzle
As noted, the connections between our topics are clear—that is, certain developments made others more likely: fewer separate opinions and fractured decisions, for instance, contributed to shorter and more rapid decisions. However, all of this might prompt the conclusion that these shorter, speedier decisions would also increase in number. We need not expect quantities approaching those of the early 1980s (when speed and brevity correlated with over 100 decisions per term) to anticipate that the court’s more streamlined performance would boost the volume of decisions from 62 in 2017-18 to, say, the neighborhood of 70 in 2018-19. Instead, the number dropped to 58. Diminished output seems a paradoxical result for what, in many respects, is a considerably more efficient workflow—and represents another topic for us to track in the upcoming term.
[1] In contrast, the average for the period 2012-13 through 2017-18 is 1.4 separate opinions per decision—a 40% increase.
[2] Two concurrences and one dissent. Her average of 23 for the preceding five terms consisted of seven concurrences and 16 dissents per term.
[3] The averages include title pages—but not the blank page that occurs at the end of each decision, nor appendices (which are very rare). Per curiam decisions are excluded.
[4] To be clear, the figures for separate opinions are not the average length of a single concurrence or dissent. They are the average number of pages per decision of concurrences and dissents combined.
[5] Title pages are not included in these averages. More specifically, I did not start the page count until the actual text of an opinion appeared—thus, occasionally, my count differs slightly from the count displayed in CCAP. Appendices and the blank page that occurs at the end of each decision are not counted. This is also the case for figures in a supplemental table showing the average length of majority/lead opinions written by each justice.
[6] One could argue that 3-3 per curiam decisions should also be classified as fractured, but I have not done so in this table.
[7] The figures do not include per curiam decisions.
Speak Your Mind