Last June, an examination of two measures of polarization among the justices of the Wisconsin and Minnesota Supreme Courts found significant differences between the two states but left open the question of which state’s figures were more “normal.” Only the inclusion of data from other states can lead to an answer, and we’ll take a step in this direction by inviting Iowa to join the portrait previously sketched of Wisconsin and Minnesota.
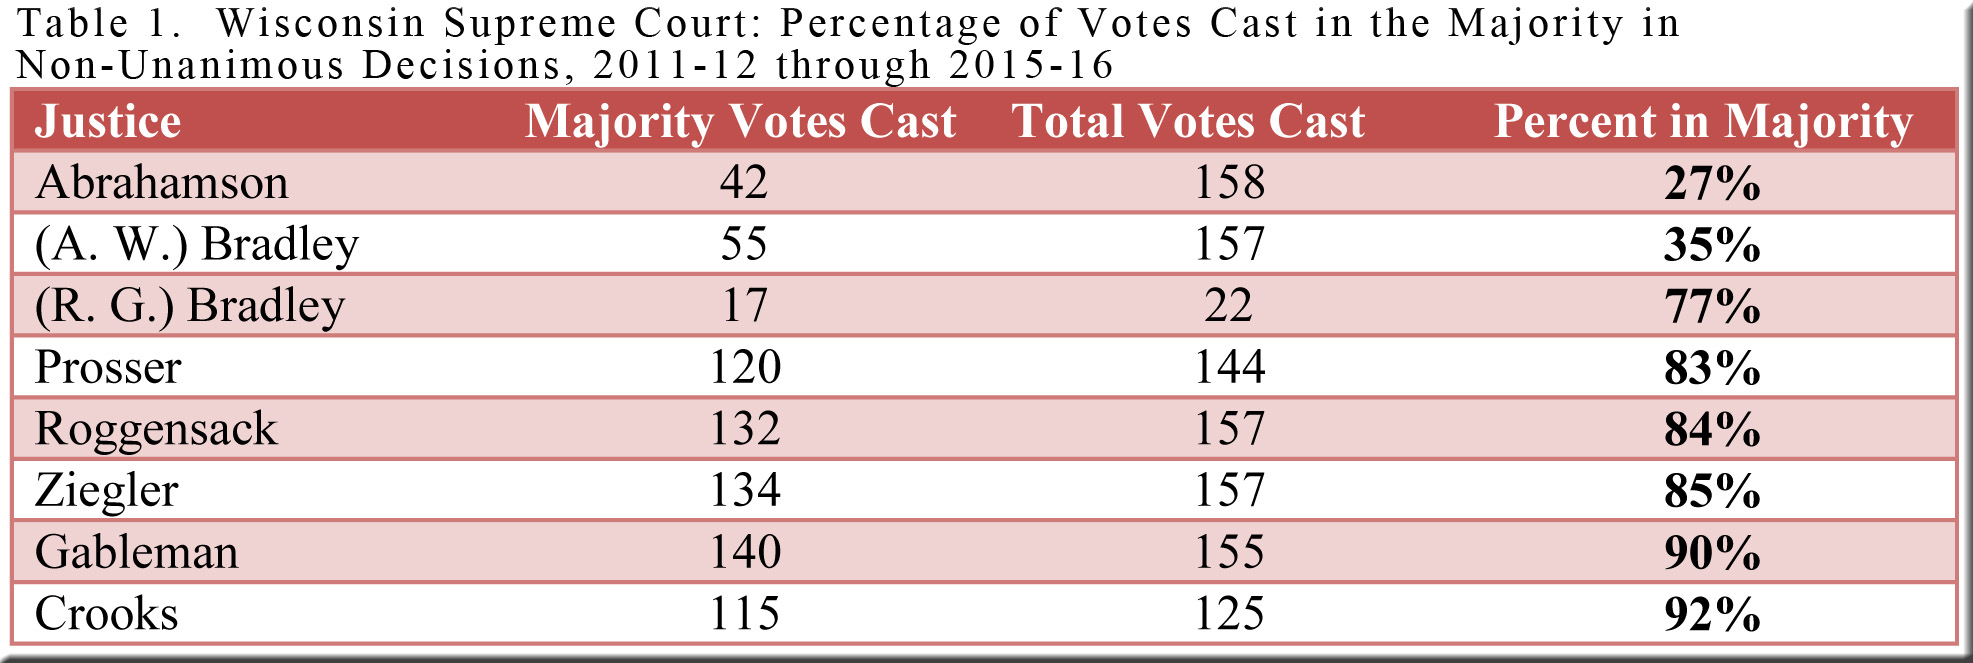
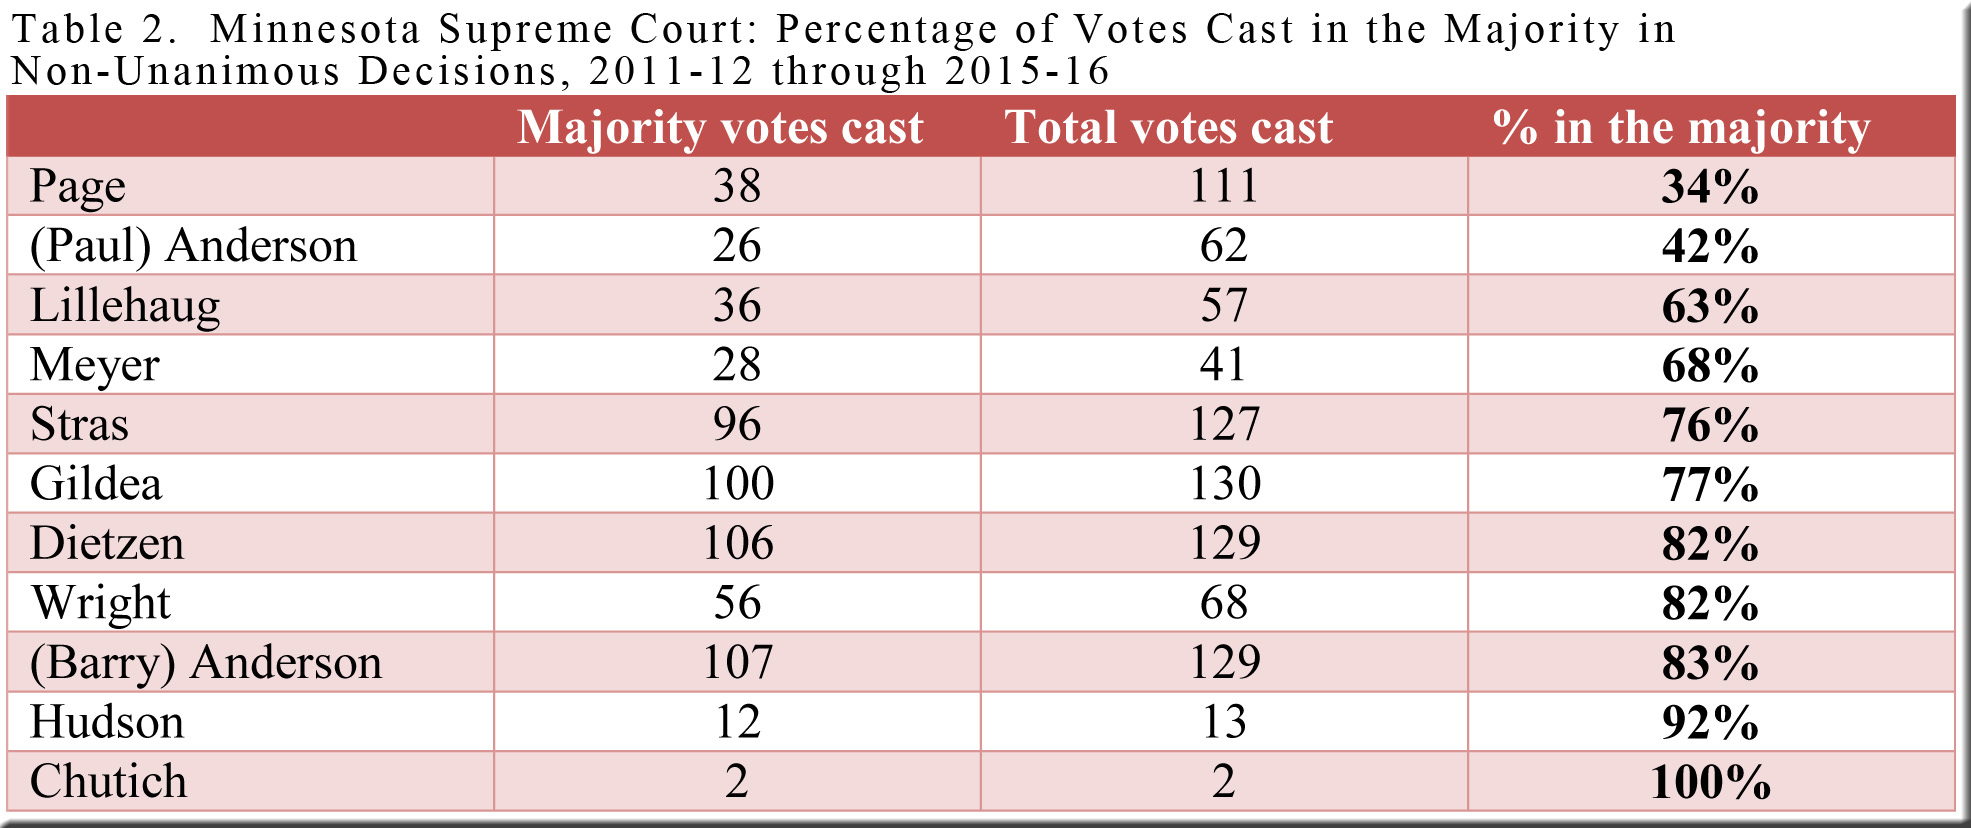
Tables 1, 2, and 3 indicate how frequently the justices from each state voted in the majority over the past five terms in cases where the decision was not unanimous.[1] Even a cursory scan reveals that in all three states a pair of justices voted in the majority markedly less often than their five colleagues. More specifically, Justices Mansfield and Waterman in Iowa occupied the same positions as Justices Page and Paul Anderson in Minnesota and Justices Abrahamson and Ann Walsh Bradley in Wisconsin, none of whom joined the majority in even half of the decisions under consideration.
That said, Justices Mansfield (47% of the time in the majority) and Waterman (48%) were less sharply divorced from their colleagues in Iowa than Justices Page (34%) and Anderson (42%) were removed from their fellow justices in Minnesota—and especially in comparison to the isolation of Justices Abrahamson (27%) and Bradley (35%) from the rest of the court in Wisconsin. Nevertheless, the similarity between the three states (each with a pair of justices much more closely aligned with each other than with their five colleagues) may seem as noteworthy as the variation (that is, the differing extents to which the three pairs of justices were separated from their colleagues). At most, then, the tables might suggest that Minnesota and Iowa diverge less from each other than either does from Wisconsin, but not to a remarkable degree.
(click on tables to enlarge them)
The June post (which compared only Wisconsin and Minnesota) found a considerably greater difference between the two courts when unanimous decisions were added to the discussion. Not to put too fine a point on it, the Minnesota Supreme Court filed a far larger percentage of unanimous decisions (and a much smaller percentage of contentious decisions) than did the Wisconsin Supreme Court. Now, with information from Iowa in hand, we can see which of its two northern neighbors the Hawkeye State resembles more strongly on this score.
Given such a large gap between Wisconsin and Minnesota on this measure of polarization, one might expect to find the Iowa Supreme Court located not only between the other two courts but some distance removed from either. As Tables 4, 5, and 6 demonstrate, however, Iowa’s voting pattern closely matches Minnesota’s regarding both unanimous and contentious decisions—and is thus remote from the vote splits characteristic of the Wisconsin Supreme Court.[2]
During the five terms under our review, 71% of the decisions in Iowa and 72% in Minnesota were unanimous, compared to only 39% in Wisconsin. If 5-2 and 4-3 votes are taken as indications of contentious decisions, the share of such decisions in Wisconsin—49%—is ten percentage points higher than the portion of Wisconsin decisions that were unanimous. Nothing of the sort took place in the other two states, where contentious cases yielded only 24% of the decisions filed in Iowa and only 20% of the filings in Minnesota—dwarfed by the 71-72% of decisions that were unanimous in these two courts.
If Iowa and Minnesota are at all close to the norm regarding voting patterns in state supreme courts, then the question posed at the outset has an answer. Wisconsin is a distinct outlier, with a supreme court whose decisions suggest a conspicuously polarized group of justices.[3] However, as noted in last month’s post regarding the three states, such a conclusion must remain a hypothesis until data from additional states can be acquired. Advancing from a question to a hypothesis is certainly progress, but for the moment we can go no further.
[1] The tables cover only one term (or the fraction of one term) served by four of the justices: Justice Rebecca Bradley in Wisconsin, whose term began in 2015-16, as did the terms of Justices Hudson and Chutich in Minnesota. Also in Minnesota, Justice Meyer’s last term came in 2011-12 (the first year covered by the tables). The Minnesota table does not include Acting Justices, who served in only a handful of cases. Three fractured decisions—State v. Lynch (Wisconsin, 2011AP002680-CR); In re the Guardianship of Jeffers J. Tschumy (Minnesota, A12-2179); and State vs. Tyler (Iowa, 13–0588)—are omitted.
[2] Due to rounding, the percentages in these tables do not always add up to 100. Per curiam decisions are omitted. As in Tables 1-3, State v. Lynch; In re the Guardianship of Jeffers J. Tschumy; and State vs. Tyler are omitted.
[3] As observed in the June post, opinions will vary regarding desirable targets for these percentages. Does a hefty portion of unanimous decisions indicate that the justices are collegial and efficient, or defenders one and all of the same outlook, or both? Do polarized vote splits suggest a court in which diverse opinions have found a voice, or a venomously partisan court, or both? One needs to look beyond these figures (as have numerous commentators and earlier SCOWstats posts) for additional information of use in interpreting the apparently unusual degree of polarization in the Wisconsin Supreme Court.


Speak Your Mind