The term “polarized” has hovered over the Wisconsin Supreme Court in recent years, and it continues to provoke controversy regarding its applicability to the justices in Madison. One of the reasons for the dispute is the absence of a generally-accepted way to gauge “polarization” in this context. After all, there will always be two or three justices who agree with each other more frequently than they do with their other colleagues when voting on contentious cases. To what extent, then, is the resulting disagreement “normal,” and when does it reach a level of acrimony and predictability that merits the label “polarization”?
One way to assess the current court’s degree of polarization is to compare the justices’ decisions with those of justices who served on the court in earlier decades (which SCOWstats has done). Another method—the subject of this post—employs a comparison of the Wisconsin Supreme Court with the Minnesota Supreme Court. Of course, it would be necessary to study the supreme courts of several states before reaching a conclusion that Wisconsin’s voting pattern was normal, or polarized, or something else. But, as a starting point, it will be interesting to see what impressions arise from some of the ways in which the two neighboring courts can be measured against each other.
We will examine the seven terms from 2008-09 through 2014-15—when the composition of the Wisconsin Supreme Court remained unchanged, and the “polarization” debate gathered force—and begin with the question of how individual justices voted in decisions that included at least one dissent. An inspection of Table 1 (Wisconsin) and Table 2 (Minnesota) reveals some similarities between the two states.[1] For instance, in both tables there are a pair of justices—Abrahamson and (A.W.) Bradley in Wisconsin; Page and (Paul) Anderson in Minnesota—who voted in the majority much less often than did their colleagues. They appear comparatively isolated when contrasted with larger groups of justices in each table who voted in the majority roughly 80% (or more) of the time.
(click on tables to enlarge them)
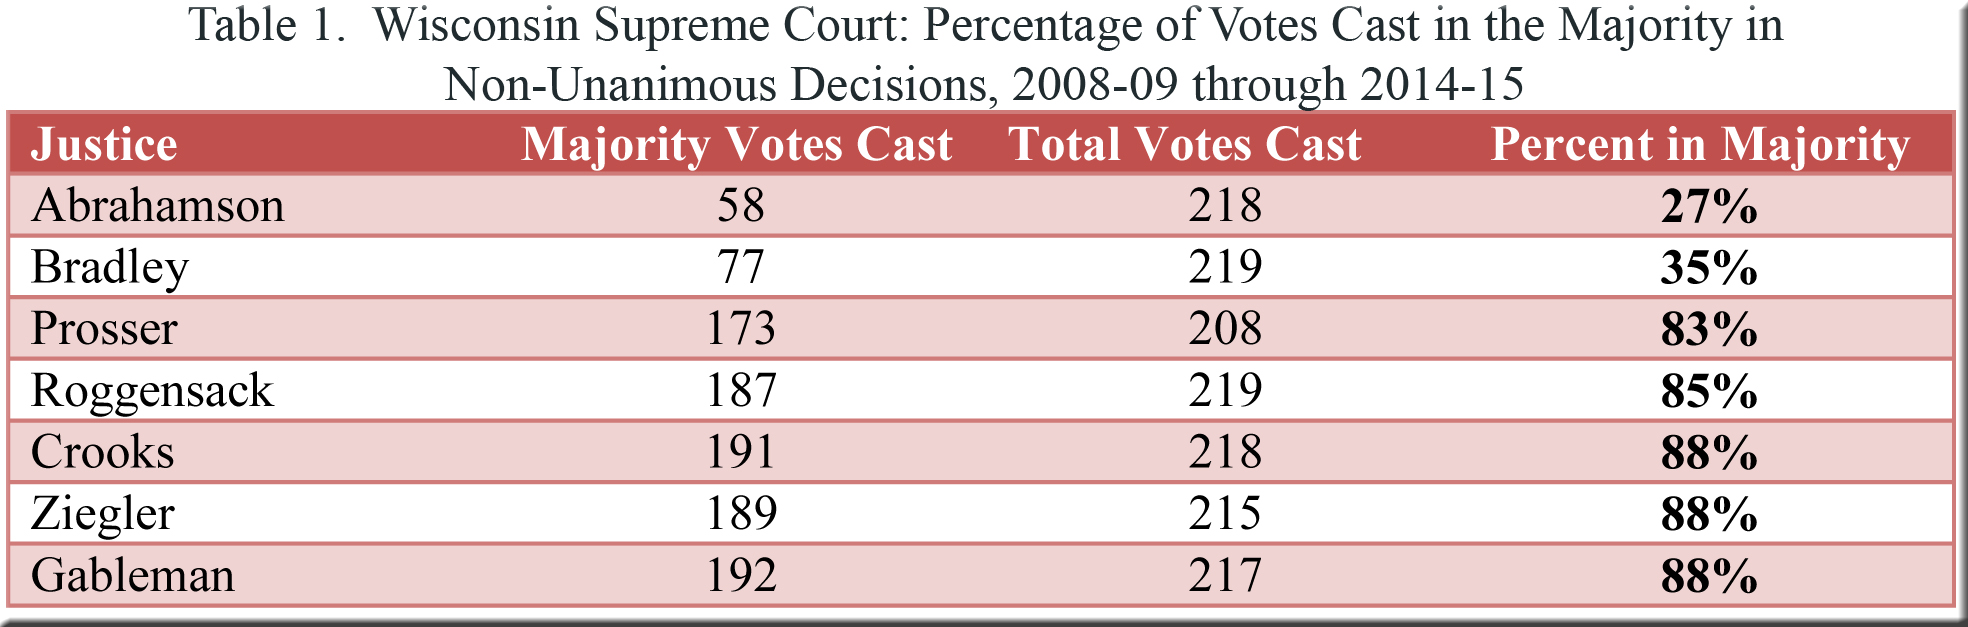

The gap is more distinct in Wisconsin. Justice Abrahamson voted in the majority at a rate well below that of Justice Page in Minnesota, and the same is true of Justice Bradley compared to Minnesota’s Justice Anderson. Moreover, the figures for all the remaining Wisconsin justices are tightly bunched and very high (between 83 and 88 percent), which, when contrasted with the percentages for Justices Abrahamson and Bradley, might be taken as a symptom of polarization.
We should bear in mind, though, that a gap also appears in the Minnesota table, clearly separating Justices Page and Anderson from their colleagues. The fact that the percentages for the other Minnesota justices are more widely scattered than they are for Justices Roggensack, Crooks, Ziegler, and Gableman in Wisconsin could be explained in part by the larger number of Minnesota justices in the table (due to turnover on the court during the period in question). All things considered, I’m guessing that readers may be rather evenly divided as to whether the similarities or the difference between the two tables are more striking. Thus, an effort to apply the tables’ information to the question at hand might suggest, at most, that Wisconsin’s court is more polarized than its counterpart in Minnesota, but not by a great deal.
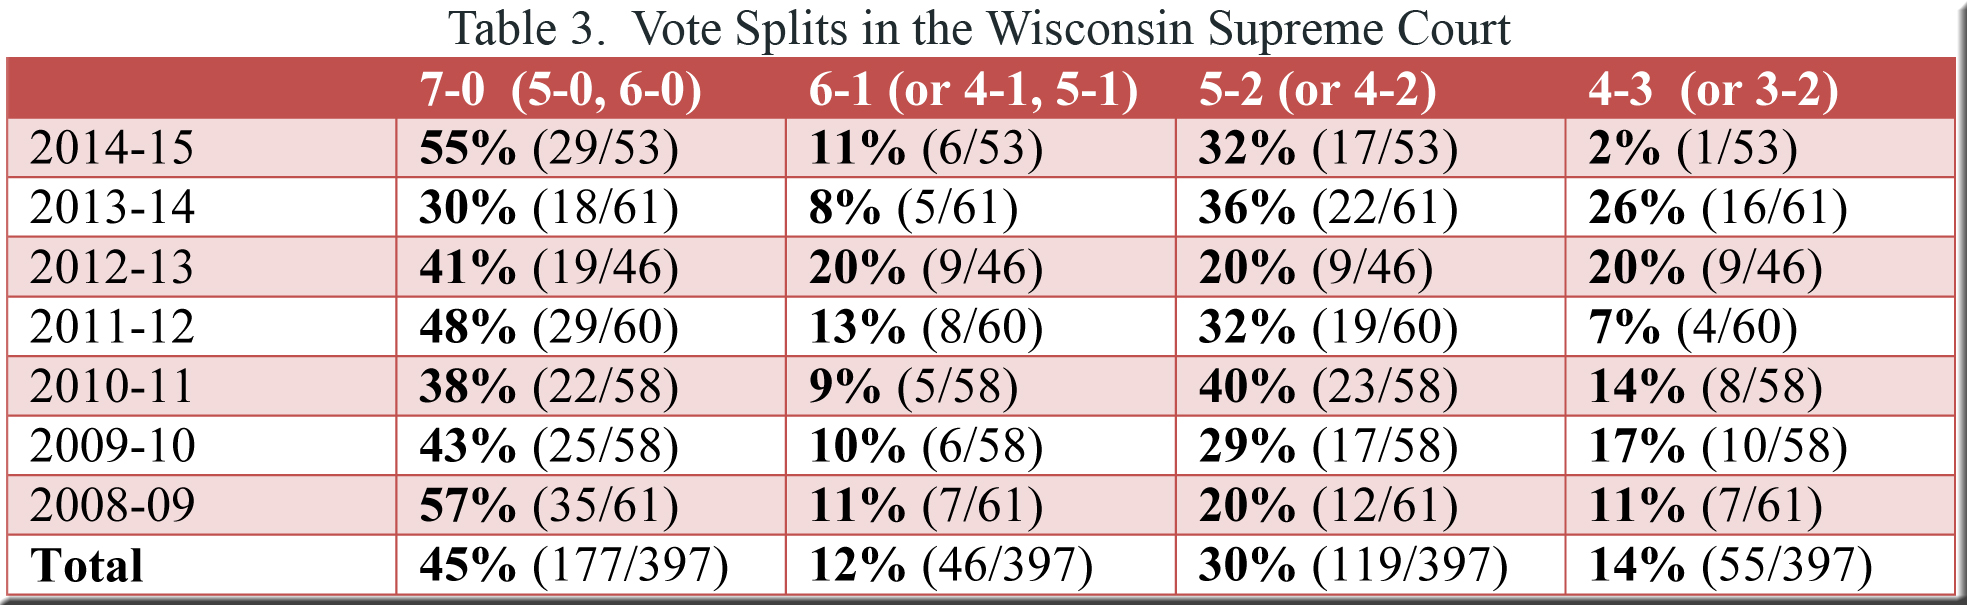
However, Tables 1 and 2 omit unanimous decisions, and when these enter the picture, the disparity between the two courts seems greater. Compare, for example, the column devoted to unanimous decisions in Tables 3 and 4.[2] Nearly three-fourths (73%) of all decisions in Minnesota were unanimous, far above the figure of 45% in Wisconsin. Given the extent of this divergence between the two states, one would expect contentious decisions to account for a larger share of the output in Wisconsin than in Minnesota, and such is indeed the case. Fully 44% of Wisconsin’s cases were decided by 5-2 or 4-3 votes, compared to only 18% in Minnesota. By these measures—percentages of unanimous and contentious decisions—polarization appears more pronounced in Wisconsin than in Minnesota.

Thus, while the topic of polarization may be approached in other ways as well (such as the frequency of discernible rancor among justices), the information above suggests a working hypothesis that polarization has been more apparent of late on the bench in Madison than in St. Paul. There remains, though, the question of how troubled one ought to be when confronted with such evidence. Do signs of polarization indicate a problem—pertaining to the court’s efficiency or credibility, perhaps? Would the comparative absence of polarization be laudable if achieved by justices who all shared a range of opinions so narrow as to dismiss the interests of much of society? Or by justices who declined if at all possible to address controversial issues?
No doubt most readers could agree that polarization can reach a point where it becomes an unambiguous defect—a disorder characteristic of a court in which voting on contentious cases can be predicted with near certainty based on intransigent ideological stances of justices who view others on the bench as adversaries rather than colleagues. Perhaps a majority of readers would even be prepared to postulate that Wisconsin has moved closer to this point than has Minnesota during the period under consideration—even if opinion remains divided (though surely not polarized) on the other questions raised in the previous paragraph.
[1] The Wisconsin figures in Tables 1 and 3 were compiled from data that can be accessed through the “Statistics for Individual Years” tab on the menu bar. Table 2 does not include “Acting Justices” in the Minnesota Supreme Court (who appeared very rarely and cast only a handful of votes).
[2] Due to rounding, the percentages do not add up to 100 in some rows of these two tables. The top line of each table indicates that the “7-0” column also includes 5-0 and 6-0 decisions. Likewise, the “6-1” column includes some 4-1 and 5-1 decisions; the “5-2” column includes some 4-2 decisions, and the “4-3” column includes a few 3-2 decisions.
Speak Your Mind