Two posts this June compared the performances of the Wisconsin and Minnesota Supreme Courts and found significant differences. As substantial as the contrasts were, however, the comparison of only two states made it impossible to conclude that one state’s supreme court was more unusual than the other’s regarding the topics under consideration. To shed light on this question, the supreme courts in Wisconsin and Minnesota would have to be measured against courts from a sampling of other states, and we’ll begin the process today by adding Iowa’s supreme court to the discussion.[1]
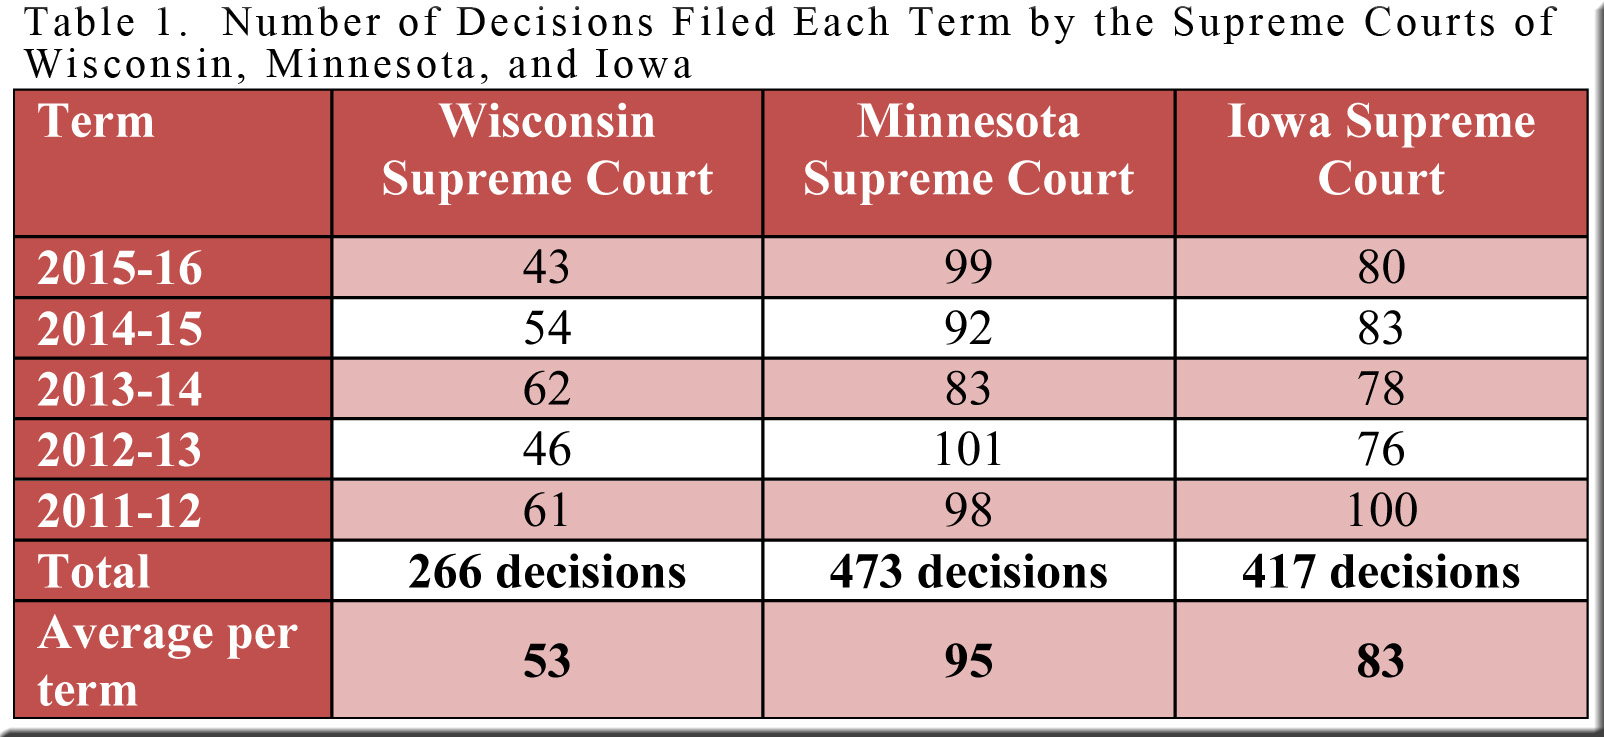
The first of the June posts focused on two issues—the number of decisions filed and their length—and found marked divergences between the figures for Wisconsin and Minnesota. Today’s post demonstrates that in both these areas, the Iowa Supreme Court’s performance places it between its two neighbors, but much closer to Minnesota than to Wisconsin. Table 1, for instance, shows that over the past five terms the Minnesota Supreme Court filed 473 decisions (78% more than Wisconsin’s total of 266 decisions), while the Iowa Supreme Court filed 417 decisions (57% more than Wisconsin’s total).[2]
(click on tables to enlarge them)
At this pace, the justices in Wisconsin would have to work for almost 16 years to file the same number of decisions that the Iowa Supreme Court would file in only 10 years, and even longer—18 years—to match Minnesota’s 10-year total.
Turning to the second topic—the average number of pages consumed by a decision—we again find Iowa much nearer to Minnesota than to Wisconsin throughout the five terms under review. During this period the average decision issued by the Iowa Supreme Court numbered 27.8 pages, which was 6.8 pages longer than the average decision in Minnesota, but 23.4 pages shorter than the average decision in Wisconsin, as detailed in Table 2.[3] Put in percentage terms, the average decision was 32% longer in Iowa than in Minnesota, but 84% longer in Wisconsin than in Iowa (and 144% longer in Wisconsin than in Minnesota).
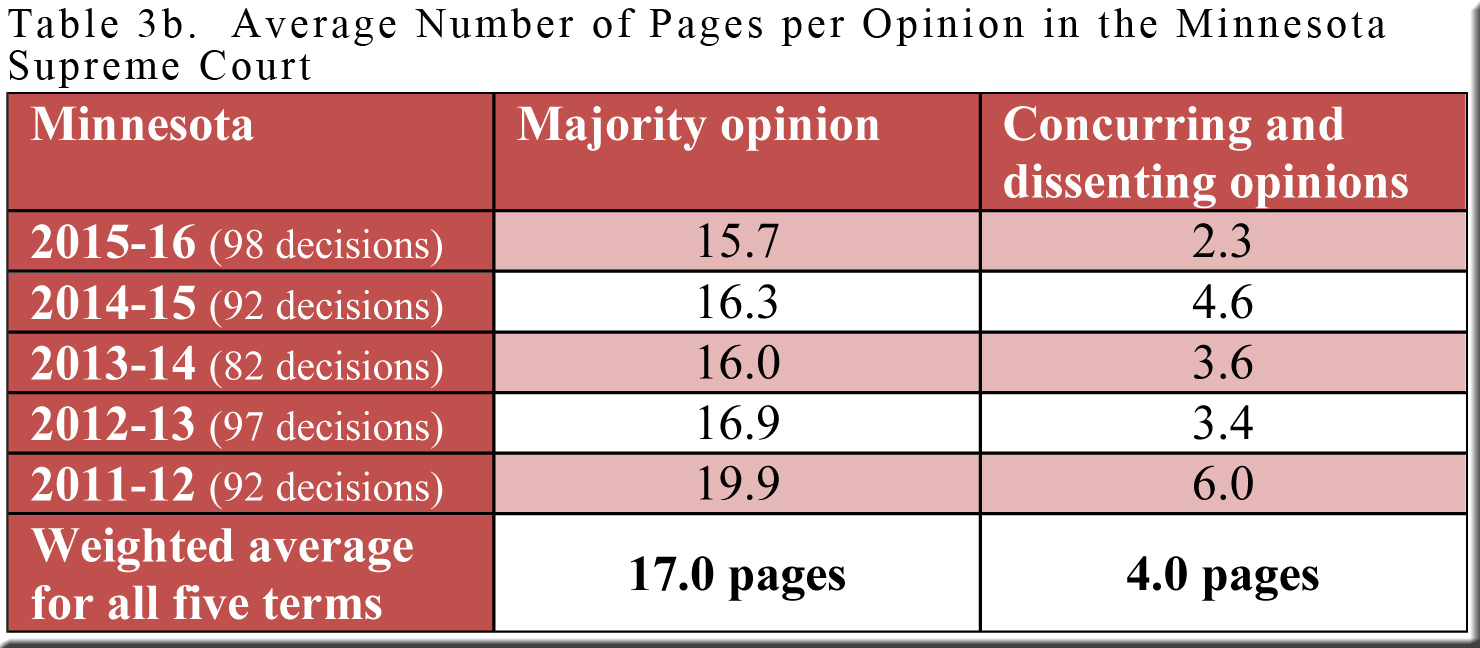
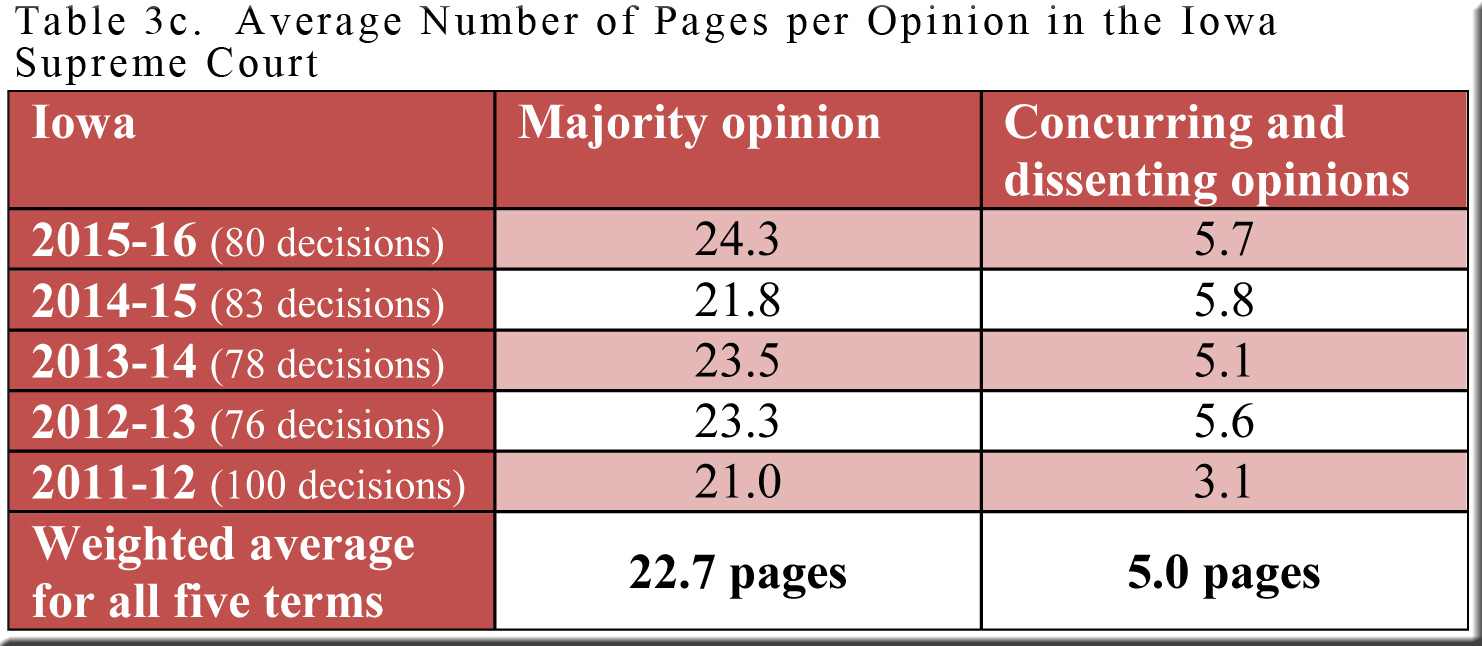
The picture changes somewhat in Tables 3a, 3b, and 3c, but our basic impression endures—with Minnesota and Iowa considerably nearer to each other than either is to Wisconsin.[4] The three states’ figures are closest in the column devoted to the average length of majority opinions alone, that is, excluding pages devoted to concurrences and dissents. Even here, though, Iowa’s average majority opinion (22.7 pages) is only 5.7 pages longer than Minnesota’s average but 11.6 pages shorter than Wisconsin’s. Translated again into percentage terms, the average majority opinion was 34% longer in Iowa than in Minnesota, but 51% longer in Wisconsin than in Iowa. Thus, with concurrences and dissents omitted, Iowa still leans conspicuously toward Minnesota’s norm rather than toward Wisconsin’s.
Even without a prior glance at Tables 3a, 3b, and 3c, one could deduce from the foregoing discussion that the largest difference between Wisconsin on the one hand and Minnesota and Iowa on the other may be found in the column devoted to concurrences and dissents. The disparity was particularly stunning in 2015-16, but it is vivid as well in the averages for all five terms. More specifically, Iowa’s five-term average of five pages of concurrences and dissents per decision was 25% larger than Minnesota’s average of four pages, while Wisconsin’s average of 17.1 pages exceeded Iowa’s by 242% and Minnesota’s by 328%. Over the five terms, only 40% of Iowa’s decisions contained any separate opinions, as did only 37% of the decisions in Minnesota—compared to 84% of the decisions filed in Madison.
For the moment, then, Wisconsin is a distinct outlier, though our sample of only three states does not permit this impression to be advanced as anything more than a hypothesis requiring further testing. But testing we can do, and it will be interesting to see where other supreme courts turn up along a spectrum expanding to include more states.
[1] The seven justices on the Iowa Supreme Court are each appointed by the governor from a list of candidates provided by the State Judicial Nominating Commission. After serving a comparatively brief initial term, a justice may retain his/her seat by standing for election to a full term of eight years. Justices may be reelected to multiple terms but must retire no later than age 72.
[2] Terms run from September 1 to the end of the following August. The figures in Table 1 include a small number of per curiam decisions from the Wisconsin and Minnesota Supreme Courts but not the several summary affirmances filed each year by the Minnesota Supreme Court. The Iowa Supreme Court averaged approximately three per curiam decisions per term, which I have not included in Table 1. These Iowa decisions tend to be very short (often just 2-3 pages) and are filed with the instruction that the decision not be published. In addition, for all three states, I have omitted orders pertaining to (1) disciplinary measures involving members of the legal profession and matters regarding admission to the bar; and (2) various petitions, motions, and other actions that did not yield opinions.
[3] The figures in Table 2 include title pages, majority opinions, and separate opinions. Per curiam decisions are omitted.
[4] Per curiam decisions are omitted in Tables 3a, 3b, and 3c. Title pages are included as part of the majority opinions.


Speak Your Mind