On July 13, the Supreme Court filed its last substantive decisions of the term, making it possible now to offer impressions of the court’s complete body of work for 2015-16. Some findings provide detail regarding speculation that emerged months ago, while other information pertains to points that have received less attention.
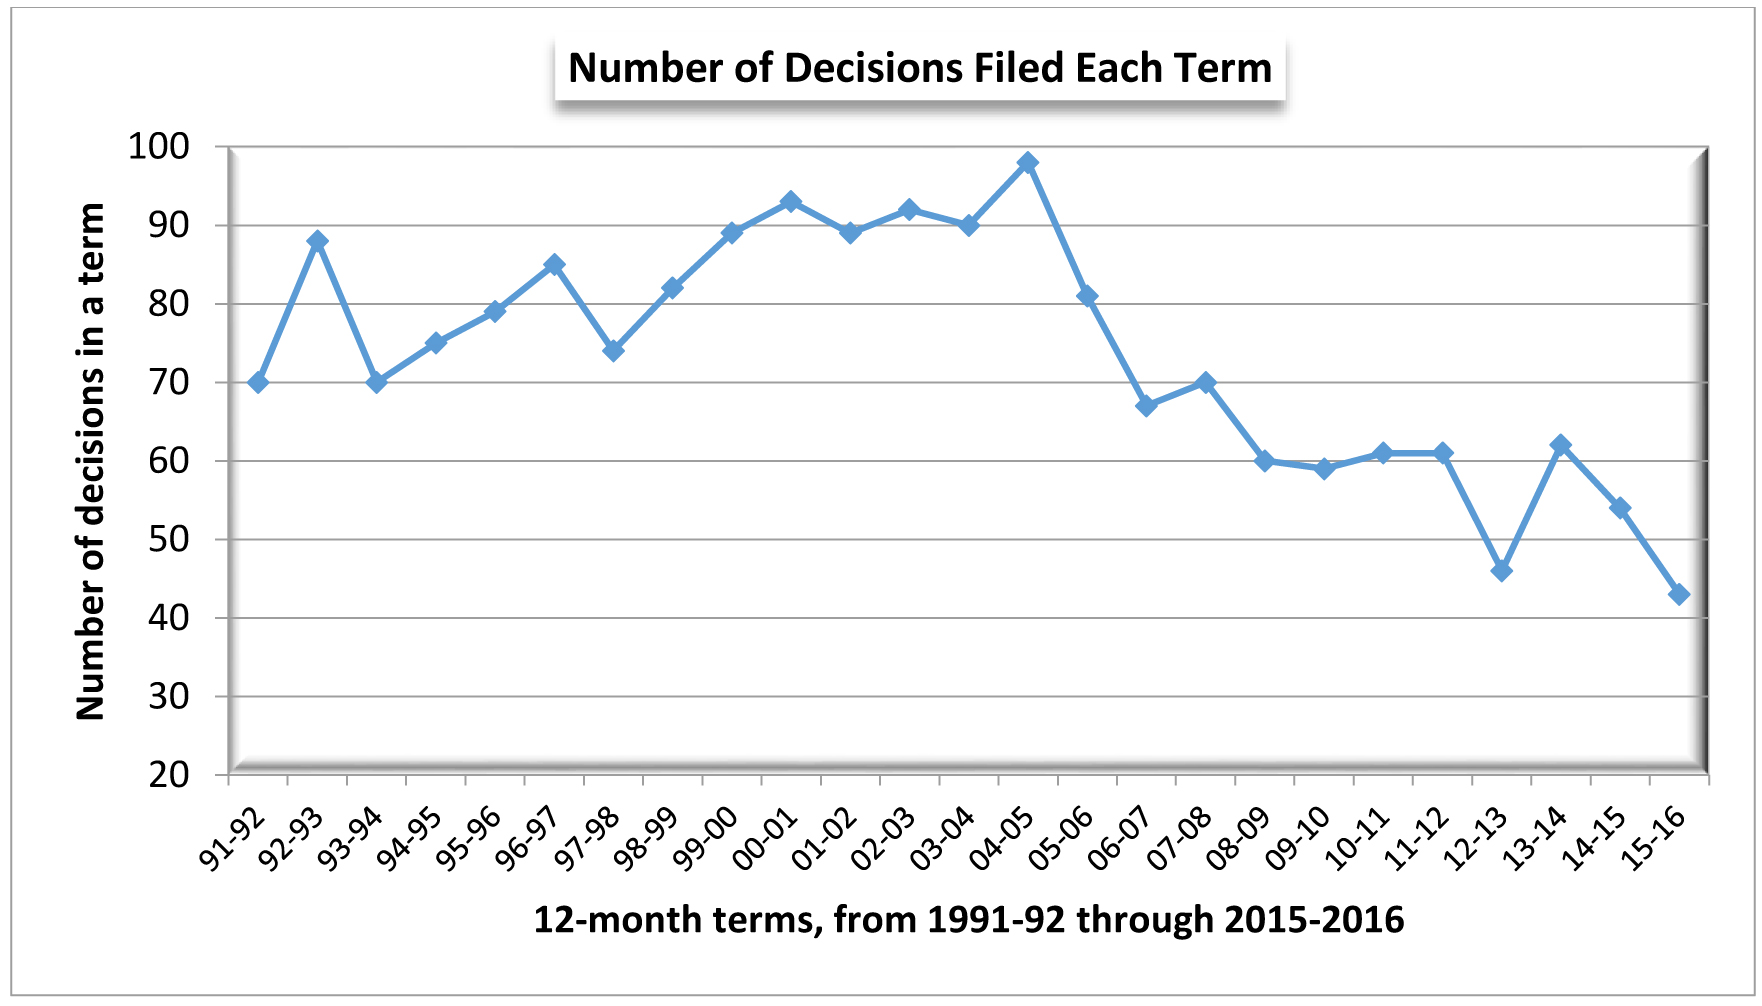
First, it is no secret that the court has been issuing comparatively few decisions in 2016, and the data in hand make it clear how markedly the flow has ebbed this year. By term’s end, the justices had filed only 43 decisions—less than at any other time in the quarter century currently covered by SCOWstats, and less than half the total for several of the terms included in the graph below.[1]
(click on graphs and tables to enlarge them)
A year ago, the biggest surprise in our assessment of the 2014-15 term was the presence of only one 4-3 decision in the justices’ output. In 2015-16, there were seven 4-3 (or 3-2) decisions, accounting for 18% of all the decisions filed. These numbers are much closer to the norm for previous terms, but in certain respects the 4-3 decisions for 2015-16 still bear some unexpected features. For one thing, as detailed in Table 1, each of the decisions had a different combination of justices in the majority, which could not be said of any of the 24 preceding terms except for 2014-15 with its single 4-3 decision, and 1995-96 which had only two.

More significantly, one might anticipate that given the ascendancy of the court’s five conservative justices, varying combinations of them would constitute most of these one-vote majorities. Such was not the case, however, as the two liberals on the bench (Justices Abrahamson and A.W. Bradley) each appeared in the majority four times—as often as anyone else except for Justice Gableman (five times), and slightly more often than Justices Roggensack and Ziegler (3 times each).[2]
This in turn might suggest that talk of a polarized court should be muted—until we shift our gaze to other possible vote splits. Indeed, for me, the most remarkable information of anything in these charts resides in the 7-0 and 5-2 columns of Table 2.[3] Fully 60% of the cases in 2015-16 were decided by 5-2 (or 4-2) votes, far above the percentage for any of the 24 preceding terms. Put another way, the figure of 60% for 2015-16 was three times larger than the average (19%) for the period 1991-92 through 2014-15.[4] And if we ask how often individual justices appeared in the majority (or minority) in these 5-2 votes in 2015-16, we find nothing like the relatively even distribution of justices evident in the 4-3 decisions. The court’s conservative members thoroughly dominated the profusion of 5-2 and 4-2 votes—supplying the entire majority in four-fifths of these cases and leaving Justices Abrahamson and Bradley isolated in the minority.[5]
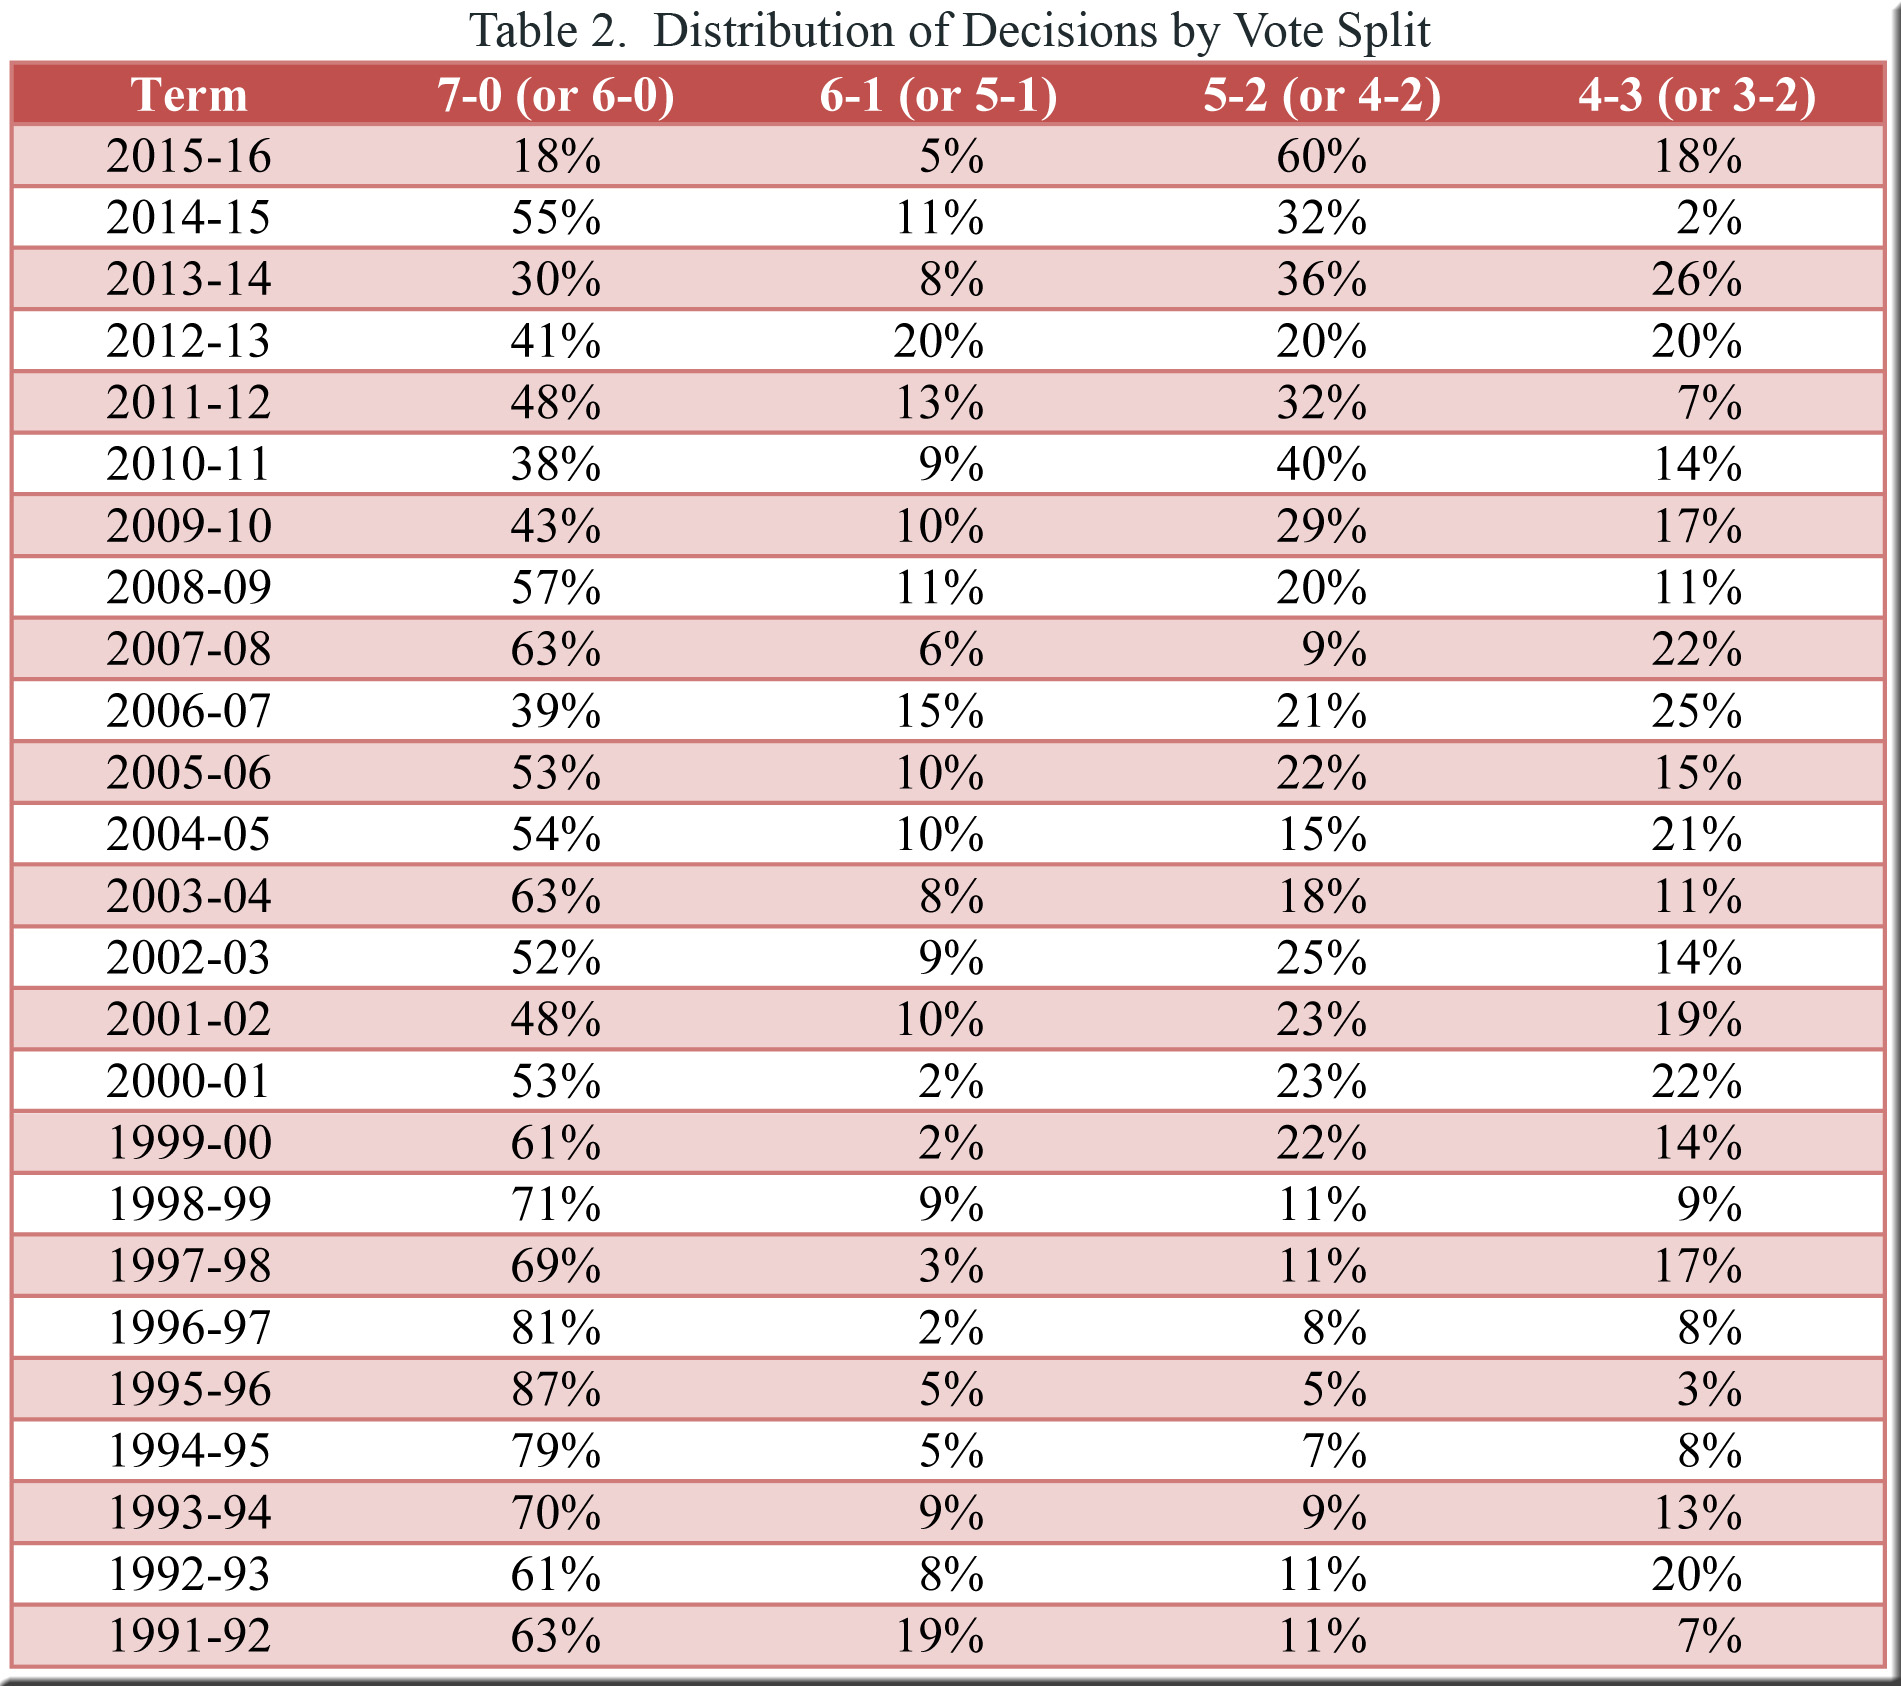
Meanwhile, the share of unanimous decisions plunged to 18% in 2015-16, well below the figure for any other individual term and just a fraction of the average of 57% for the preceding terms taken together.[6] If we follow the lead of previous posts and consider the percentage of unanimous decisions and the percentage of contentious (5-2 and 4-3) decisions as two of the factors deserving attention in a discussion of the court’s polarization, the figures presented above indicate that the Wisconsin Supreme Court may be every bit as riven as suggested by the tone here and there in last week’s State v. Lynch opinions.[7] Assuming that contentious decisions may be viewed as a symptom of polarization, it bears noting that an extraordinary 78% of the court’s decisions in 2015-16 crowded into this category of 5-2 and 4-3 vote splits, a substantially larger share than in any other term and close to two and a half times the average of 33% for all 24 of them.[8]
In a few days SCOWstats will post a fuller set of tables for the 2015-16 term, employing the format established for earlier terms accessible through the “Statistics for Individual Years” tab on the menu bar. Thereafter we will revisit other themes that have appeared in recent posts and see what light the 2015-16 term has cast on them.
[1] The total of 43 decisions does not include orders pertaining to various motions, petitions, and disciplinary matters. It does include two 3-3 per curiam decisions and the fractured decision in State v. Patrick J. Lynch.
[2] Justice Rebecca Bradley joined the court only after the death of Justice Crooks and thus did not participate in as many decisions as the other justices.
[3] The table does not include 3-3 per curiam decisions and rare fractured decisions (State v. Patrick J. Lynch in 2015-16, for example) that do not fit in the table’s columns. As a result of rounding, the percentages in some rows do not add up to one hundred.
[4] Even when isolating just the terms from 2008-09 through 2014-15, when all of the court’s current members served together, except for Justice Rebecca Bradley, we find that 5-2 (and 4-2) decisions averaged “only” 30% of all decisions.
[5] All of the decisions for 2015-16 may be found on the court’s website.
[6] The average for 2008-09 through 2014-15 was 45%, and for 1991-92 through 2007-08 it was 63%.
[7] To cite but one of the five opinions filed, Justice Roggensack struck this note in the opening sentence of her concurrence: “The writing of Justice Shirley S. Abrahamson and Justice Ann Walsh Bradley herein causes concern because it diminishes the significant and sensitive issues for which review was granted; attempts to demean the writings of other justices rather than addressing legal reasoning they employ; and may evidence a pattern of joint writing that is bottomed in a desire to injure rather than to inform.”
[8] One could also categorize the two 3-3 per curiam decisions in 2015-16 and the fractured decision in State v. Lynch as contentious. The average share of contentious decisions for 2008-09 through 2014-15 was 44%, and for 1991-92 through 2007-08 it was 30%.
Speak Your Mind