Two posts this June compared the performances of the Wisconsin and Minnesota Supreme Courts and found significant differences. As substantial as the contrasts were, however, the comparison of only two states made it impossible to conclude that one state’s supreme court was more unusual than the other’s regarding the topics under consideration. To shed light on this question, the supreme courts in Wisconsin and Minnesota would have to be measured against courts from a sampling of other states, and we’ll begin the process today by adding Iowa’s supreme court to the discussion.[1]
Comparing the Wisconsin, Minnesota, and Iowa Supreme Courts–Part 1
September 27, 2016 by Leave a Comment
1990-91 and 2015-16: Some Contrasts
September 1, 2016 by Leave a Comment
Much has changed at the Wisconsin Supreme Court over the past 25 years, including all but one of the justices.[1] A pair of recent posts provided data regarding the supreme court’s activity at each end of this quarter century—1990-91 and 2015-16—which now furnish us an opportunity to compare these two terms with a focus on topics that have figured prominently in SCOWstats.
Number and Speed of Decisions
In certain respects, a comparison of the beginning and end of this 25-year interval accentuates trends already apparent for several years—developments such as the growing period of time required to generate a shrinking number of decisions. Thus the 83 decisions filed in 1990-91 nearly doubled the total of 43 filed in 2015-16, yet the average period between oral argument and the filing of a decision was roughly a month and a half shorter in 1990-91 than in 2015-16 (91 days and 136 days respectively).[Continue Reading…]
Wisconsin Supreme Court Statistics, 1990-1991
August 22, 2016 by Leave a Comment
These tables are derived from information contained in 83 Wisconsin Supreme Court decisions that were turned up in a Lexis search for decisions filed between September 1, 1990, and August 31, 1991. The total of 83 decisions does not include rulings arising from (1) disciplinary proceedings against lawyers and (2) various motions and petitions.
The tables are available as a complete set and by individual topic according to the subsets listed below.
Four-to-Three Decisions
Decisions Arranged by Vote Split
Frequency of Justices in the Majority
Distribution of Opinion Authorship
Frequency of Agreement Between Pairs of Justices
Average Time Between Oral Argument and Opinions Authored by Each Justice
Number of Oral Arguments Presented by Individual Firms and Agencies
The 2015-16 Term: Some More Impressions
August 1, 2016 by Leave a Comment
Writing jointly in State v. Lynch three weeks ago, Justices Shirley Abrahamson and Ann Walsh Bradley observed that, “although we have not done a statistical analysis, our perception is that few of the court’s decisions this term have been unanimous without any separate writings …” Now that the 2015-16 term has expired, we can answer certain questions implicit in the justices’ comment. First, of course: What percentage of the decisions filed in 2015-16 were unanimous with no separate opinions? Second: How does this percentage compare with those for other terms? … And, apart from the issue of polarization, why might some of the justices find this development troubling?[Continue Reading…]
Wisconsin Supreme Court Statistics, 2015-2016
July 22, 2016 by Leave a Comment
These tables are derived from information contained in 40 Wisconsin Supreme Court decisions filed between September 1, 2015, and the end of the court’s term in July, 2016.[1] The total of 40 decisions does not include the following items contained in the Supreme Court’s listing of opinions and dispositional orders for this period: (1) decisions arising from disciplinary proceedings against lawyers; and (2) orders pertaining to various motions and petitions.
Sometimes the Court’s listing of opinions and dispositional orders contains separate entries for individual cases that were consolidated and resolved by a single decision. If two or more cases were consolidated in this manner, the decision is counted only once for the purposes of the following tables.
In addition to the 40 decisions noted above, two deadlocked (3-3) per curiam decisions were filed: New Richmond News v. City of New Richmond; and Yasmine Clark v. American Cyanamid Company. These are included only in the “Number of Oral Arguments Presented” table.
The justices’ work this term also included an unusual decision in State v. Patrick J. Lynch, where no more than three justices could agree to affirm, reverse, or modify the decision of the court of appeals—which thus remained in force. This case will be included only in the “Days Between Oral Argument and Opinion Filing” table and the “Number of Oral Arguments Presented” table.
The tables are available as a complete set and by individual topic according to the subsets listed below.
Four-to-Three Decisions
Decisions Arranged by Vote Split
Frequency of Justices in the Majority
Distribution of Opinion Authorship
Frequency of Agreement Between Pairs of Justices
Average Time Between Oral Argument and Opinions Authored by Each Justice
Number of Oral Arguments Presented by Individual Firms and Agencies
[1] According to the Clerk’s office, no additional substantive decisions will be filed after July 13. The decisions may be found on the Wisconsin Court System website.
Fantasy League Honors its Stars
July 20, 2016 by Leave a Comment
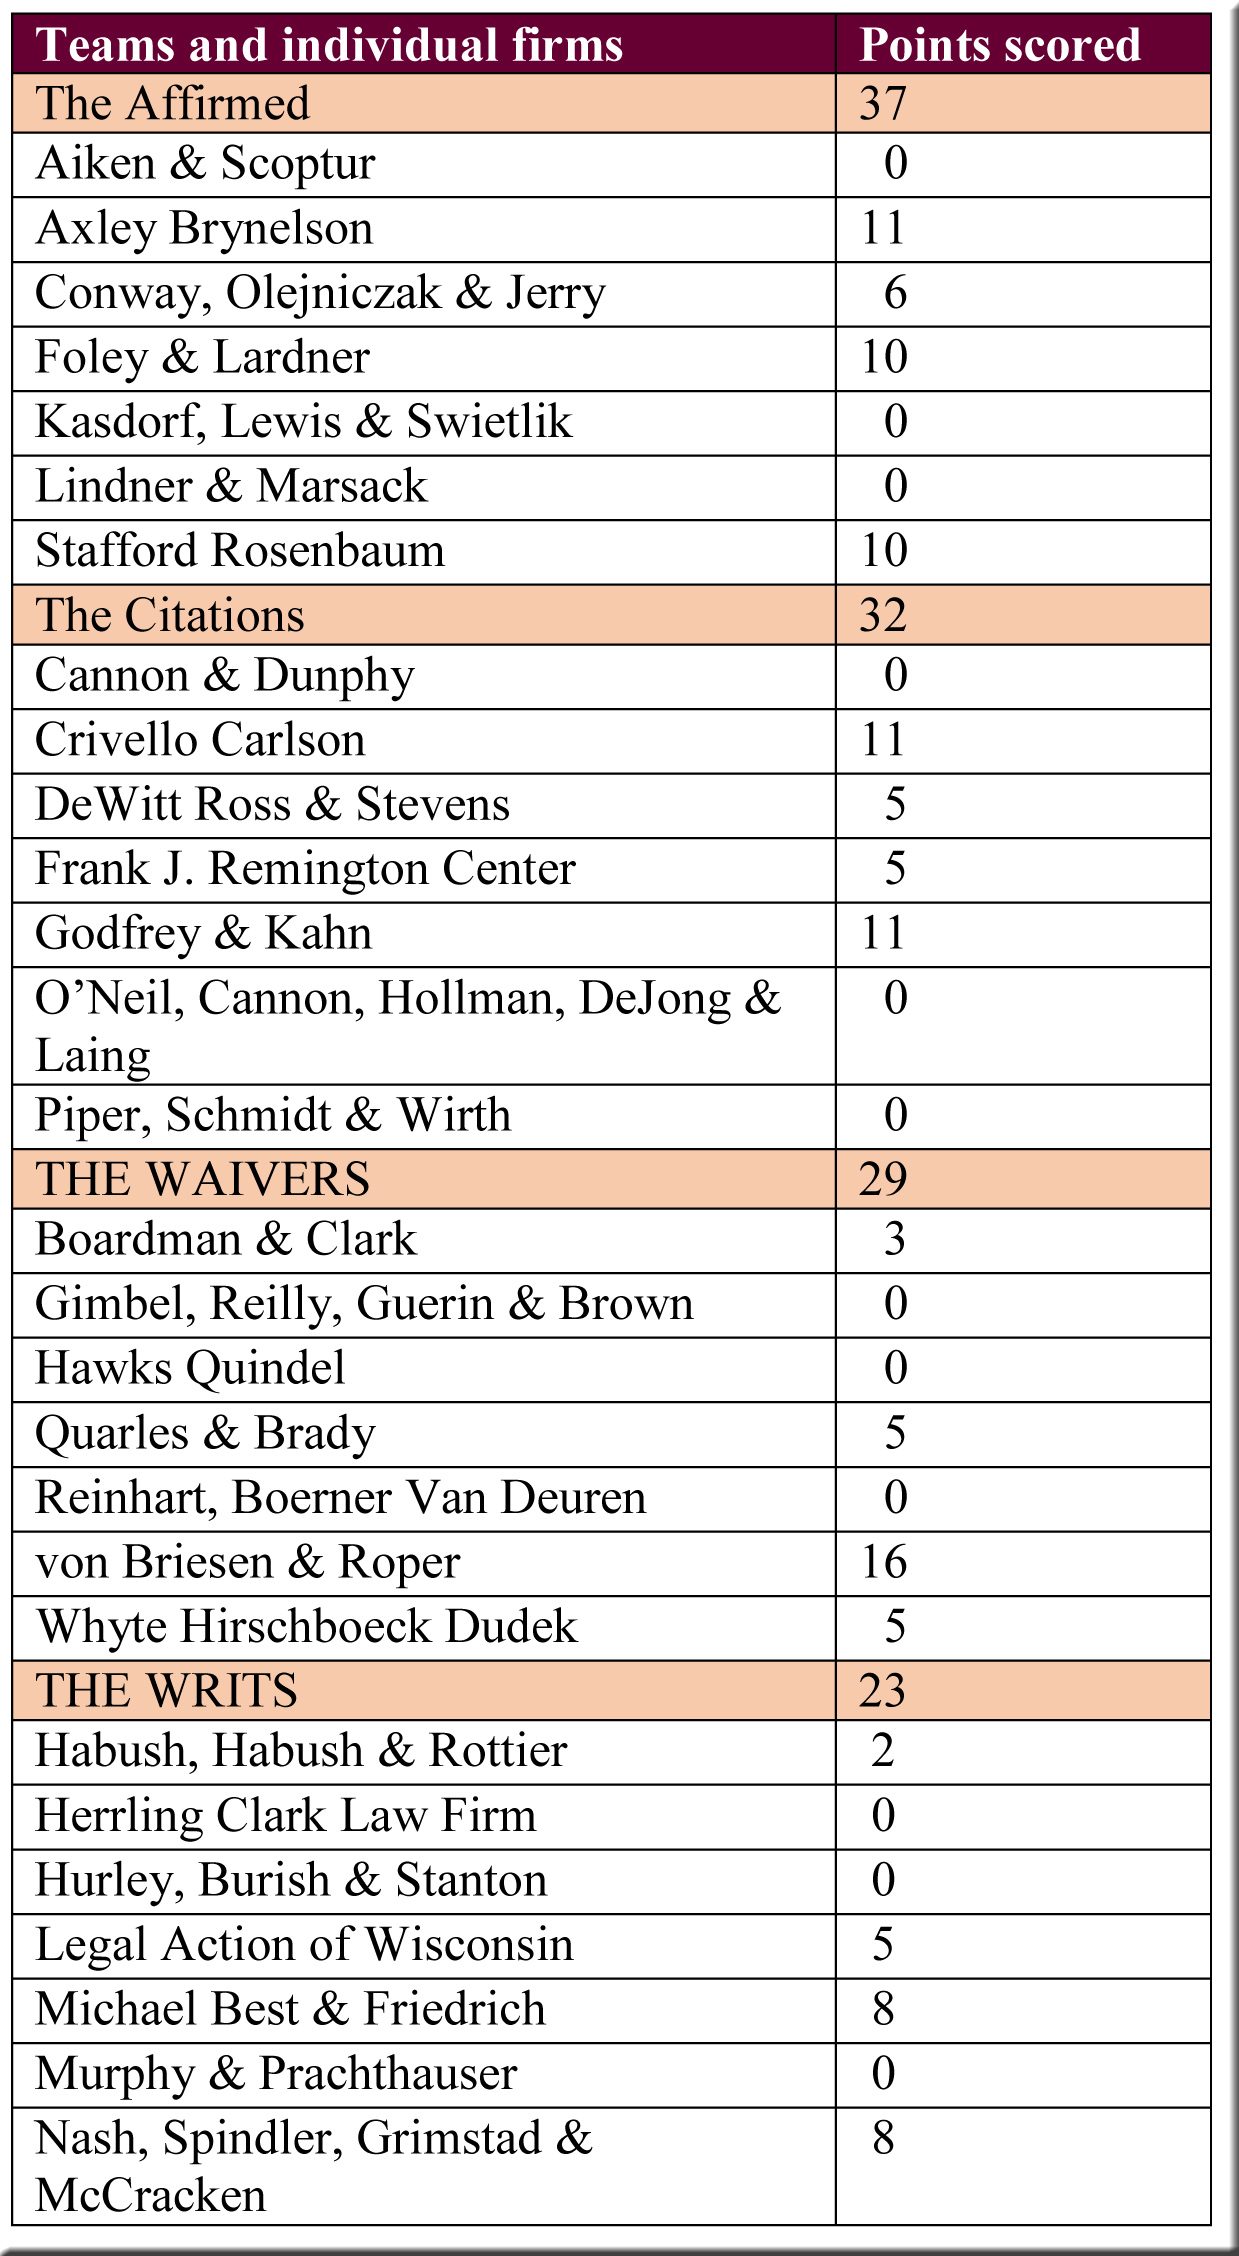
The filing of the supreme court’s last substantive decisions a week ago brought the 2015-16 term to an end and thus served as the final whistle in the fantasy league’s inaugural season—a spectacle of spirited competition in which the Gavels of the State Public Defender’s Office did not secure their victory until the last flurry of decisions released by the court. The Gavels were led by attorneys Kaitlin Lamb and Catherine Malchow, whose performances accounted for nearly half of their team’s 45 points.
Several law firms from other teams also distinguished themselves, and if you were unable to attend last Saturday’s awards banquet, you may be interested to learn the final results for the Gavels’ competitors.
At its winter meeting, the Selection Committee will begin filling out the rosters for next season’s teams. Committee members will study how frequently individual law firms have appeared before the supreme court over the past few years and decide on that basis which participants from 2015-16 have been sufficiently active to retain roster spots in 2016-17—and which firms will be relegated, thereby making room for more active newcomers deserving an opportunity to showcase their vigor.
The Supreme Court’s 2015-16 Term: Some Initial Impressions
July 18, 2016 by Leave a Comment
On July 13, the Supreme Court filed its last substantive decisions of the term, making it possible now to offer impressions of the court’s complete body of work for 2015-16. Some findings provide detail regarding speculation that emerged months ago, while other information pertains to points that have received less attention.
First, it is no secret that the court has been issuing comparatively few decisions in 2016, and the data in hand make it clear how markedly the flow has ebbed this year. By term’s end, the justices had filed only 43 decisions—less than at any other time in the quarter century currently covered by SCOWstats, and less than half the total for several of the terms included in the graph below.[1][Continue Reading…]
Fantasy League Update
July 13, 2016 by Leave a Comment
Teams collected points from three of the decisions released yesterday and today— Lands’ End, Inc. v. City of Dodgeville; State v. Timothy L. Finley; and Aman Singh v. Paul Kemper—resulting in a dramatic change in the standings.
The Affirmed tallied 20 points—10 from Stafford Rosenbaum (a brief, oral argument, and favorable outcome in Lands’ End) and 10 from Foley & Lardner (a brief, oral argument, and favorable outcome in Singh)—the largest gain of any team this season and enough to jump all the way from the cellar into second place. In fact, had the State Public Defender’s Office not answered in Finley (10 points for a brief, oral argument, and favorable outcome), the Affirmed would have taken over first place. The Citations completed the scoring—5 points from DeWitt Ross & Stevens for a brief and oral argument in Lands’ End—not enough to hold off the Affirmed, but sufficient to move past the idle Waivers into third place.
Fantasy League Update
July 6, 2016 by Leave a Comment
Today’s trio of decisions (Sonja Blake v. Debra Jossart; State v. Leopoldo R. Salas Gayton; and Dennis D. Dufour v. Progressive Classic Ins. Co.) brought points to four of the league’s five teams and produced multiple changes in the standings.
The Waivers made the biggest gain—10 points from von Briesen & Roper (a brief, oral argument, and favorable outcome in Dufour) and 1 point from Quarles & Brady (an amicus brief in Gayton). With these 11 points, the Waivers moved into second place, closing the gap between them and Gavels of the State Public Defender’s Office, who collected 5 points (a brief and oral argument in Gayton).
Only the Affirmed did not participate in the scoring, and as a result they were passed by the Writs, who vaulted from the cellar by adding 7 points to their total—5 points from Legal Action of Wisconsin (a brief and oral argument in Blake v. Jossart) and 2 points from Habush Habush & Rottier (an amicus brief and oral argument in Dufour). The Citations rounded out the scoring with 2 points from Godfrey & Kahn for an amicus brief and oral argument in Dufour—not enough, however, to maintain possession of second place, which they yielded to the surging Waivers.
United States v. Wisconsin–Polarization of the Courts
July 5, 2016 by Leave a Comment
“Decrying polarization is everyone’s favorite game in Washington, but in the case of the Supreme Court, it’s statistically measurable.” So began an article in The Wire at the end of the United States Supreme Court’s 2011-12 term. Referring to figures supplied by a pair of scholars at the University of Southern California and Washington University in Saint Louis, the author concluded that “there’s a strong case” that “the court is more divided than it has been in history.” Other publications that summer furnished similar assessments, including an article in The Atlantic titled “The Incredible Polarization and Politicization of the Supreme Court.” Two years later its author saw no reason to change his opinion in an essay that the New Republic ran under the title “John Robert’s Supreme Court is as Polarized as Ever.” It seemed so as well to Adam Liptak, whose “Polarized Court” in the New York Times quoted a Boston College political scientist’s conclusion that “Polarization is higher than at any time I’ve ever seen as a citizen or studied as a student of politics.”
Analogous claims have been made regarding Wisconsin’s supreme court, raising the question of how one might determine the degree of polarization on the bench in Madison. A reader suggested that, in addition to measuring Wisconsin’s court against those in other states, it might be instructive to consider the United States Supreme Court as a standard of comparison—which we will do by focusing on two indicators pertinent to the “polarization” discussion: (1) the frequency with which individual justices voted in the majority in non-unanimous decisions, and (2) the percentages of unanimous and contentious decisions during a term. [Continue Reading…]