Years have passed since our last comparison of midwestern supreme courts, so let’s return for a look at four indicators: (1) the number of decisions filed; (2) the length of these decisions; (3) the number of separate opinions; and (4) the distribution of vote margins. As Minnesota and Iowa once served as the starting point for these posts, we’ll begin again with them.
Number of decisions
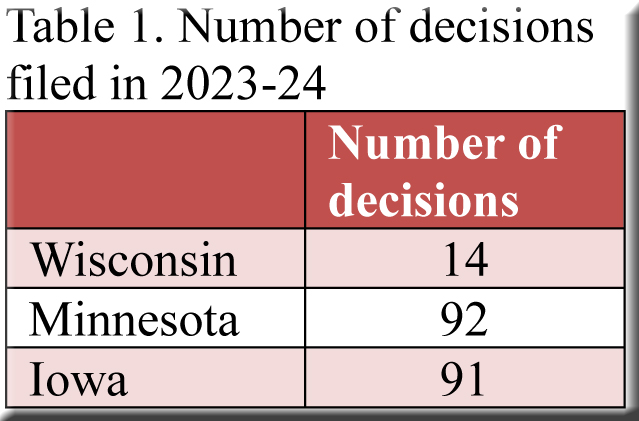
Previous posts found that the justices in Minnesota and Iowa issued much larger volumes of decisions than did their colleagues in Wisconsin, and this gap became enormous in 2023-24 due to the surprising plunge in the number of decisions filed last term in the Badger State. As shown in Table 1, the totals for Minnesota and Iowa were more than six times the output in Wisconsin.[1]
Number of pages
One might guess that Wisconsin’s decisions, while tiny in number, were longer than those filed in the other two states—and so they were. Already evident in the years covered by earlier posts, the difference expanded in 2023-24 to the point where the average length of decisions from the Wisconsin Supreme Court nearly tripled the size of decisions from Minnesota and Iowa. Wisconsin’s decisions have fewer words per page than those of adjacent states, and thus Table 2 includes a “Wisconsin-equivalent” column that indicates how long the average Minnesota and Iowa decisions would be if they contained the same number of words per page as those from Wisconsin.[2]
Number of separate opinions
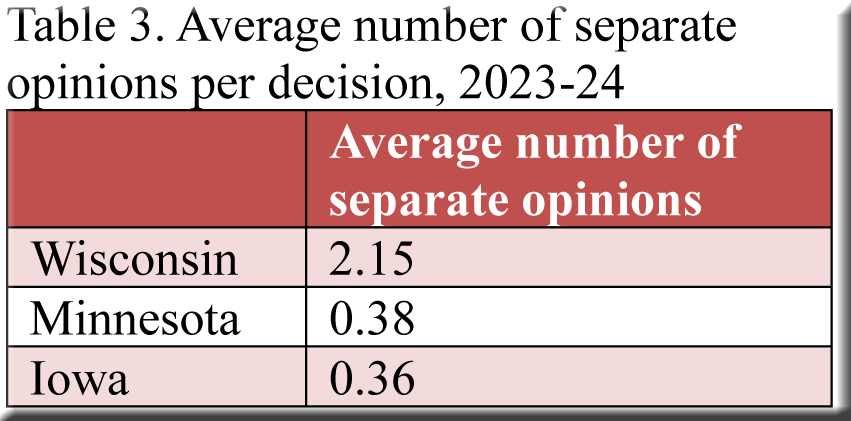
Frequent separate opinions (concurrences and dissents) contributed to the unusual length of Wisconsin’s decisions. Just as in Tables 1 and 2, here again in Table 3, virtually identical figures for Minnesota and Iowa contrast vividly with Wisconsin’s entry.[3] Not to put too fine a point on it, Wisconsin averaged almost six times more separate opinions per decision than did its two neighbors.
Vote margins
The seemingly constant stream of separate opinions in Wisconsin’s decisions encourages a conclusion confirmed in Table 4—Wisconsin’s decisions were much less likely to be unanimous, and much more likely to be contentious, than the decisions filed in Minnesota and Iowa.[4] Indeed, close to 80 percent of decisions from Minnesota and Iowa were unanimous—50 percentage points higher than in Wisconsin—while 50 percent of Wisconsin’s decisions were contentious (5-2 or 4-3 margins), compared to only 17 and 15 percent respectively for Minnesota and Iowa.[5]
No doubt opinions will differ on how to interpret such numbers, as they can be summoned to bolster conflicting impressions. For instance, does a high percentage of unanimous decisions reflect a collegial court adept at finding common ground among justices with diverse views, or a set of justices whose outlooks largely overlap, or a court reluctant to address current controversies? More than one of the above? Similarly, does a high proportion of contentious cases indicate a polarized, embittered court, or a court that represents a full range of opinion in the state, or a court prepared to weigh in on burning issues of the day—or some combination of these attributes?
What about Michigan and Illinois?
Our next post will add Wisconsin’s other two neighbors to the mix, and we’ll see how their supreme courts compare with the trio under scrutiny here.
[1] Table 1 does not include orders involving (1) disciplinary matters, (2) various petitions and motions, (3) cases where the court decided that review had been improvidently granted, and (4) deadlocked (3-3) per curiam decisions. Other per curiam decisions are included in Table 1: one for Wisconsin, four for Minnesota, and none for Iowa.
I am excluding six Iowa cases that generated very short per curiam decisions (no more than two pages) along with notes that these decisions were not designated for publication.
[2] Page totals include the title page(s), majority opinion and any separate opinions. Appendices (very rare) are omitted. Table 2 does not include per curiam decisions. The “Wisconsin-equivalent pages” for Minnesota and Iowa were calculated using average word counts derived from six cases, selected randomly, from each of the two states.
[3] Table 3 does not include per curiam decisions.
[4] Table 4 includes per curiam decisions. Due to rounding, the percentages in the table do not always add up to one hundred.
[5] Rounding explains why the figure of 15% for Iowa (the result of combining the 5-2 and 4-3 columns—that is, 14/91) differs from the 16% one would get by adding the 8% for the 5-2 column and the 8% for the 4-3 column.


Speak Your Mind