Today we’ll supplement last week’s post with findings on four additional topics: (1) the length of decisions; (2) the number of concurrences and dissents; (3) the number of days between oral argument and decision filing; and (4) the frequency of fractured decisions.
Number of pages per decision
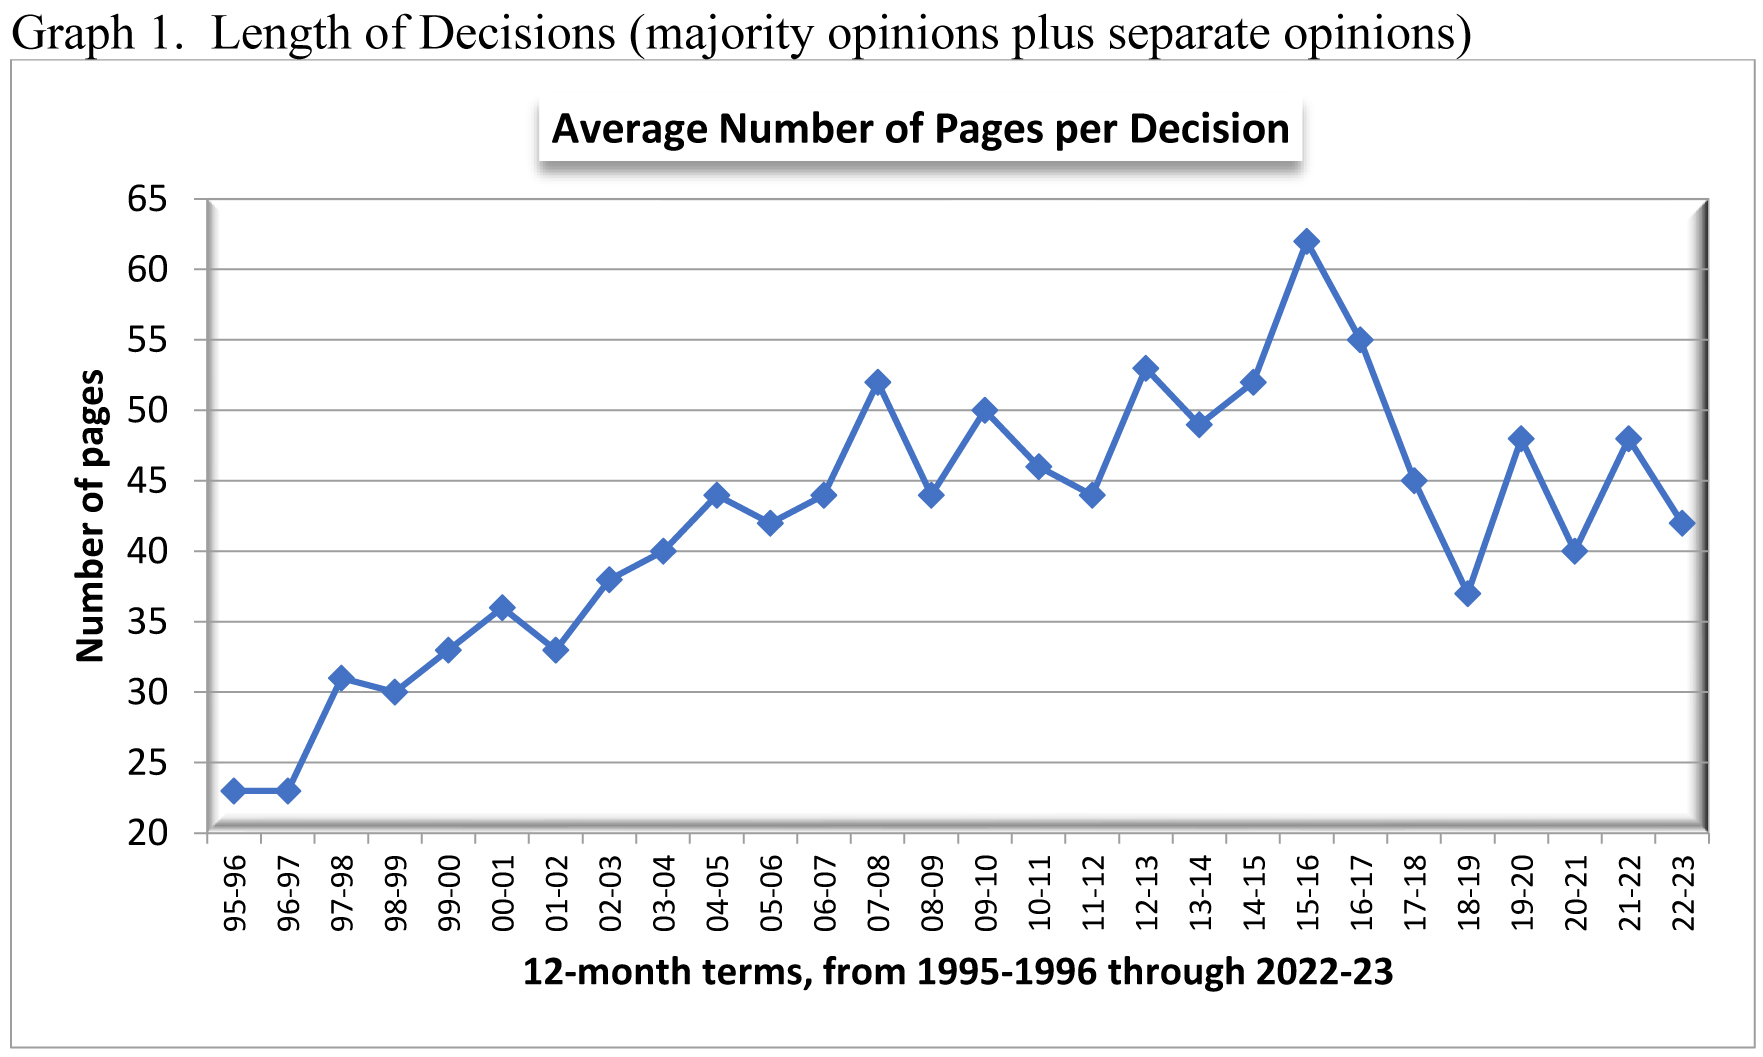
During the past few years, the average length of decisions has bounced back and forth between, roughly, 40 and 50 pages. This pattern continued in 2022-23, when the average dropped to 42 pages, down from 48 the previous term (Graph 1).[1]
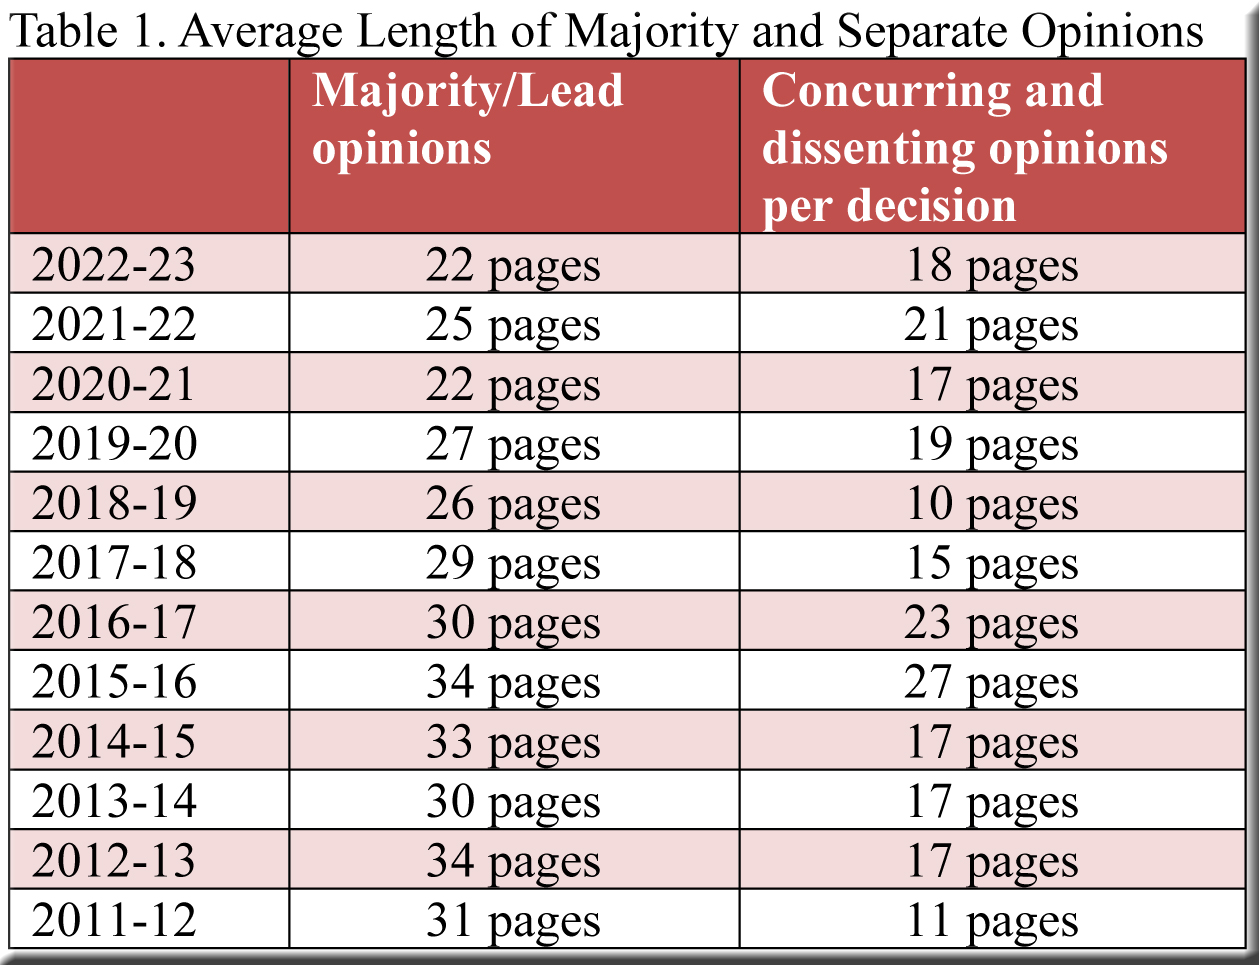
Sometimes, when moving from one term to the next, a change in the average length of decisions stemmed primarily from fluctuations in the length of separate opinions, while the average for majority opinions was less volatile, as shown in Table 1. Such was not the case, however, in 2022-23, as both majority and separate opinions shrunk by an average of three pages.[2]
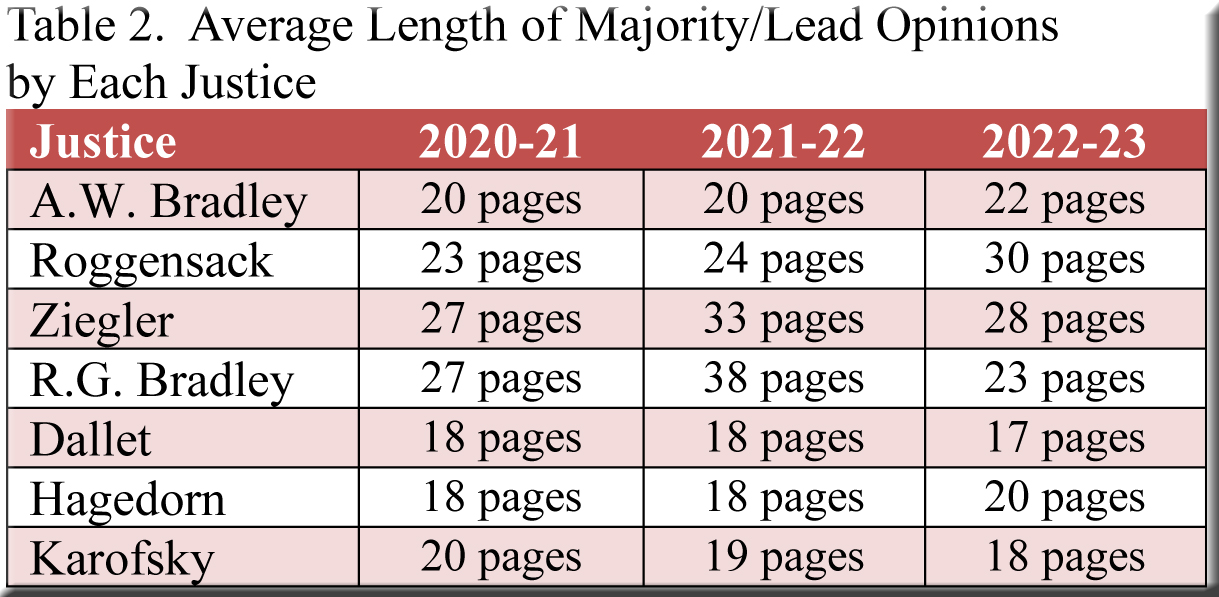
Shifting our focus to individual justices, we find that the average length of majority opinions in 2022-23 ranged from 30 pages (Justice Roggensack) to 17 pages (Justice Dallet)—smaller than the gap in 2021-22, but larger than in 2020-21 (Table 2).[3]
Number of concurring and dissenting opinions per decision
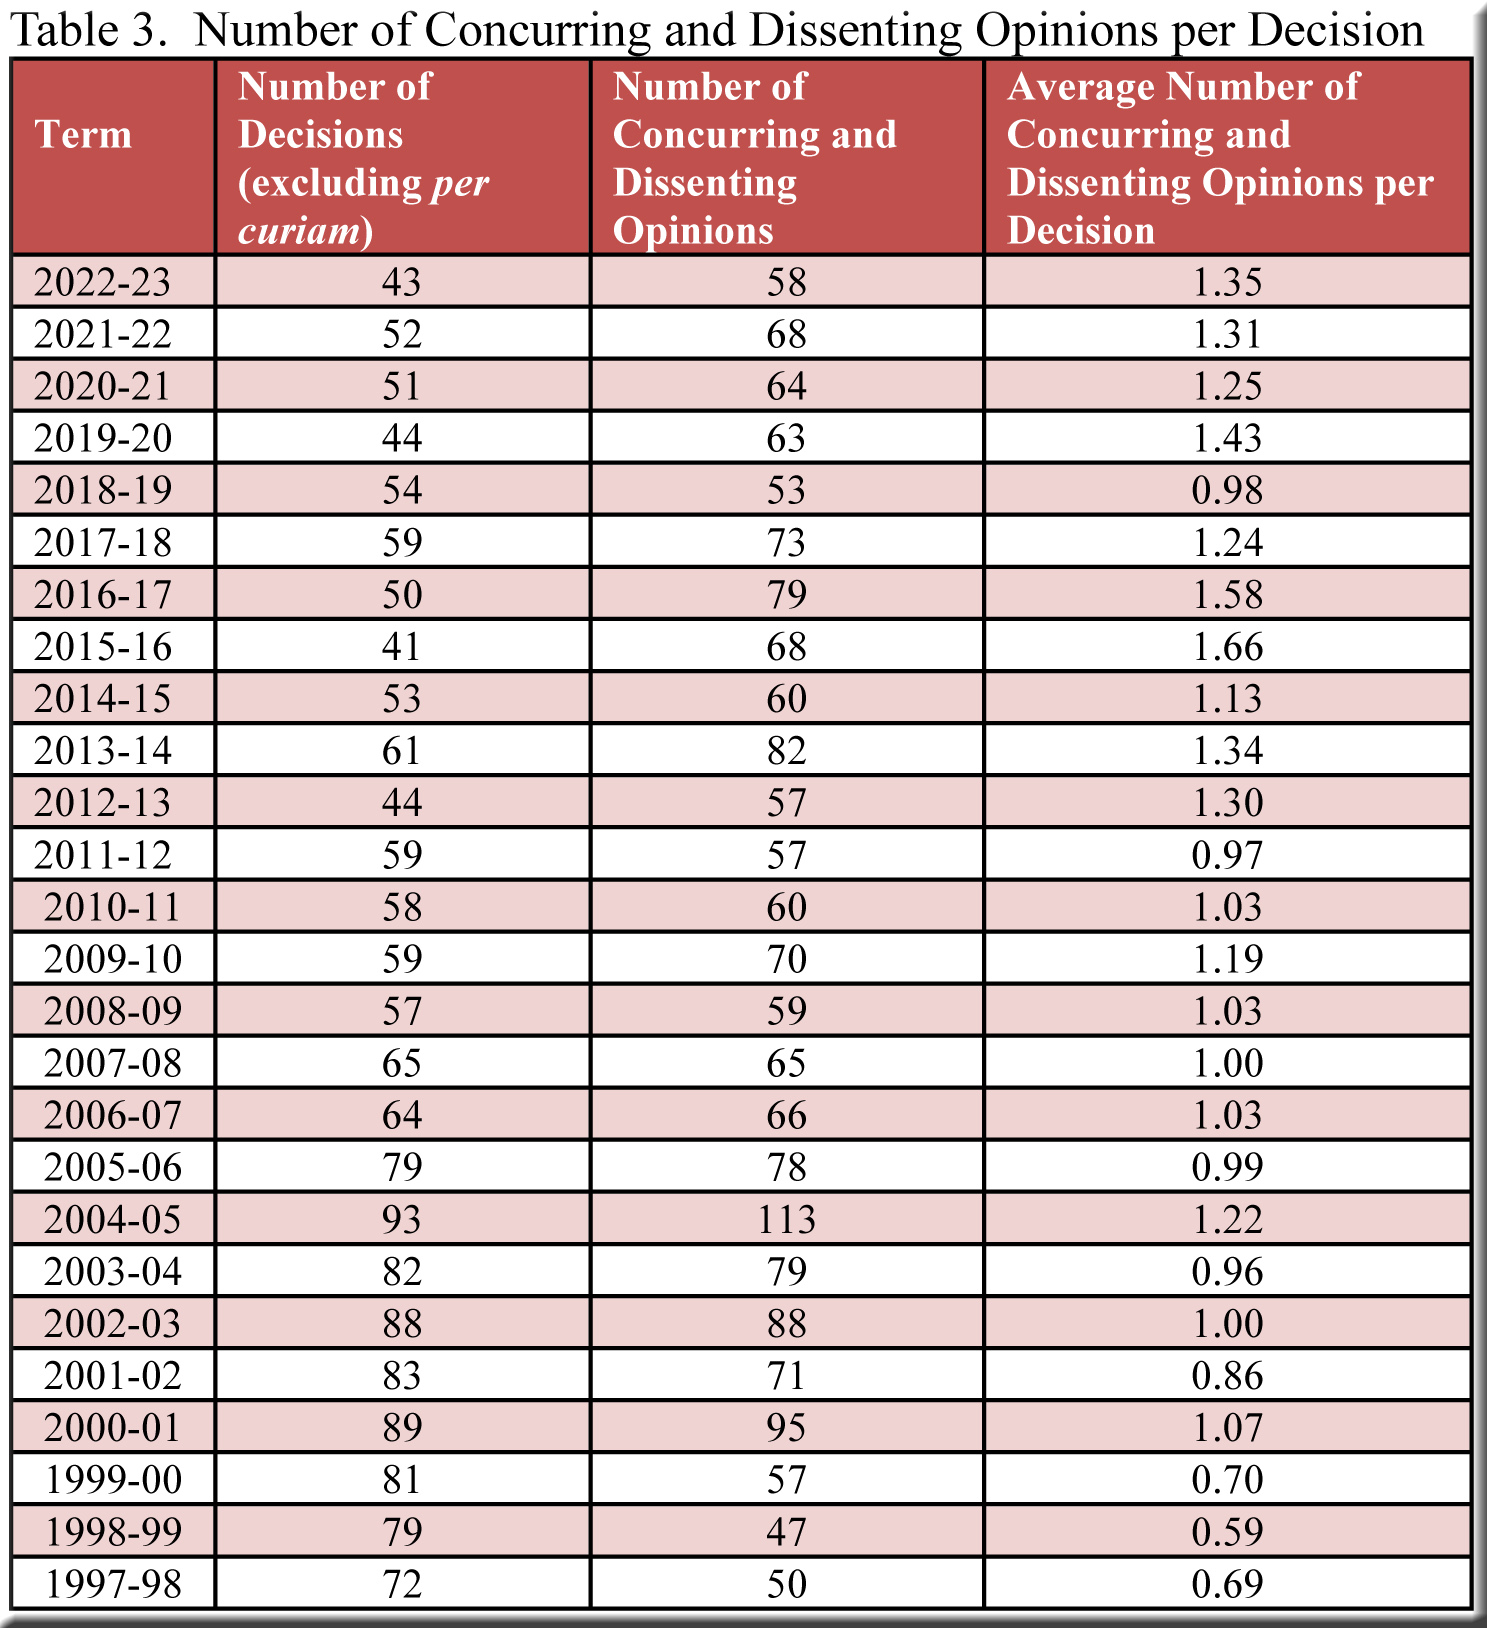
The average number of concurrences and dissents per decision crept up in 2022-23 to 1.35 (that is, an average of 1.35 concurrences + dissents per decision), exceeding all but three of the 26 years covered in Table 3.[4] In 2021-22, every justice wrote more dissents than concurrences—except for Justice Hagedorn, who authored far more concurrences than dissents. This term produced a more even distribution, with three justices (AW Bradley, Roggensack, and Ziegler) writing more dissents than concurrences, three justices (RG Bradley, Dallet, and Hagedorn) more concurrences than dissents, and Justice Karofsky an equal number of each.
Days to decision
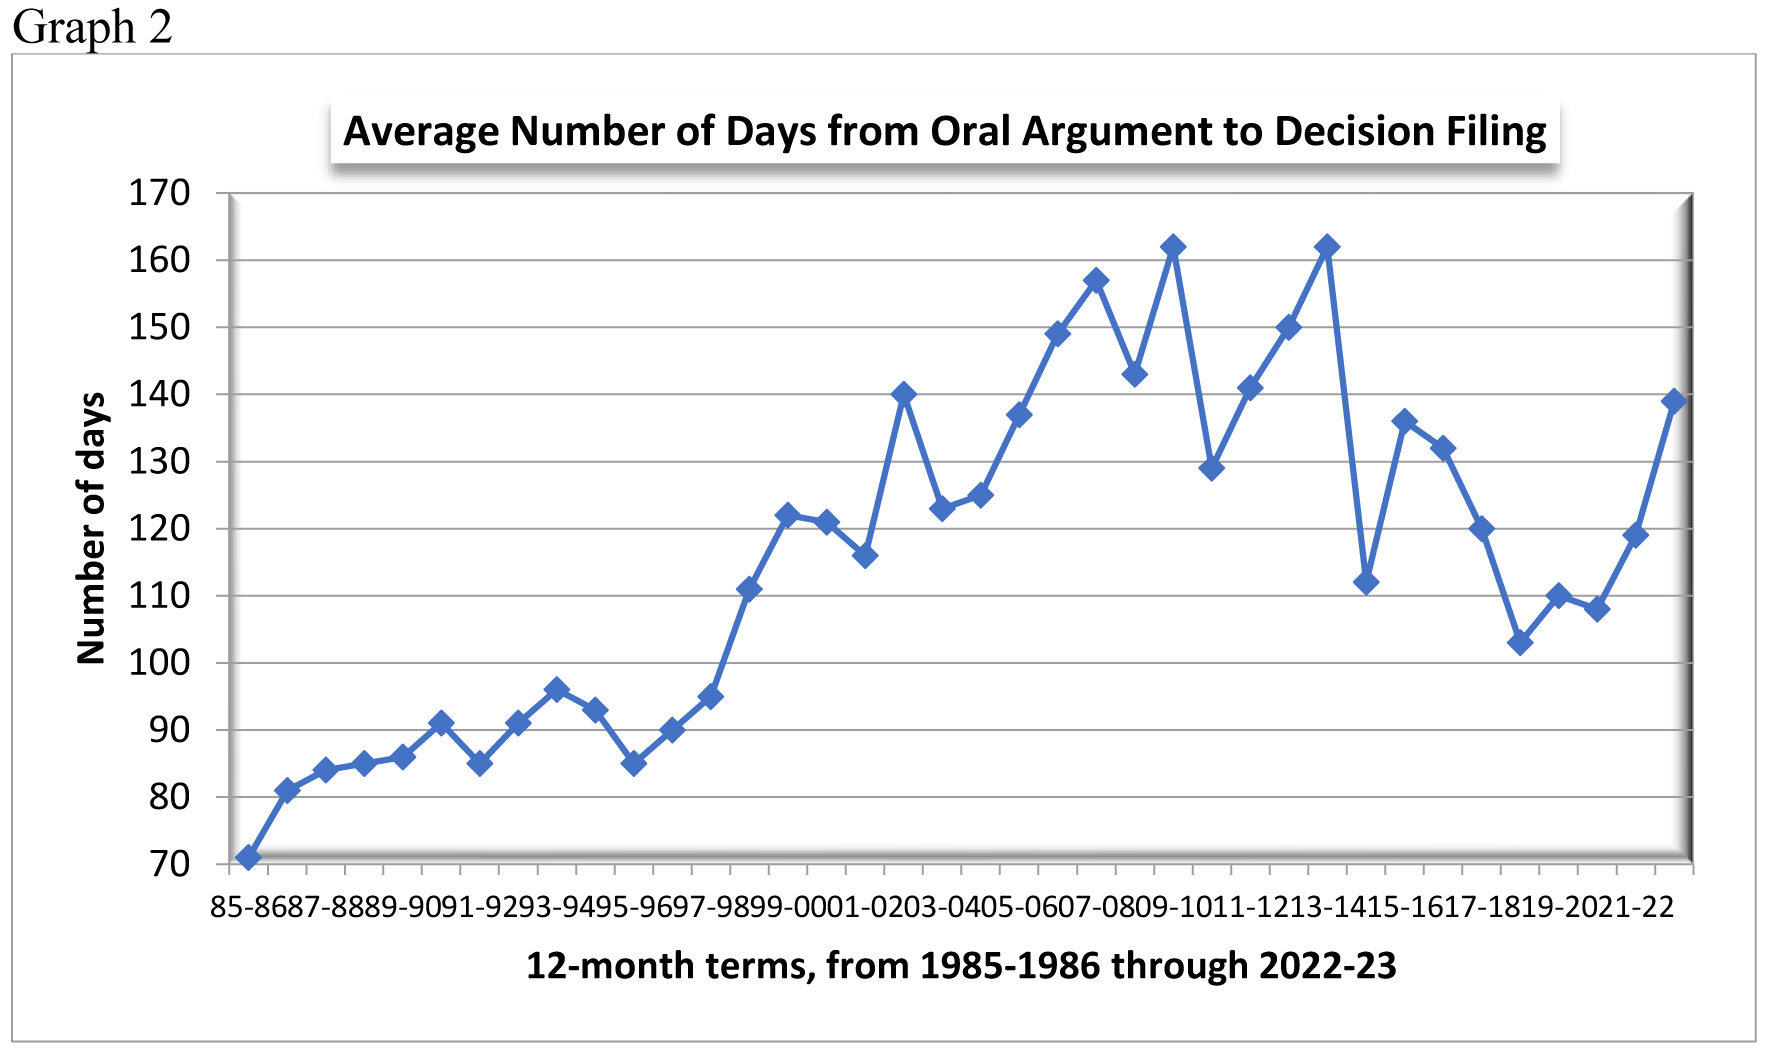
Among the topics in today’s post, the most surprising change involves the average number of days between oral argument and the filing of decisions.[5] Given the unusually small number of decisions this term and the sizeable drop in the average length of decisions, one might expect that the court would file decisions more quickly after oral argument than it did the year before. Instead, the average number of days between oral argument and decision surged to 139 days—three weeks longer than the previous term, reaching a level not witnessed since 2013-14 (Graph 2).[6]
Fractured decisions
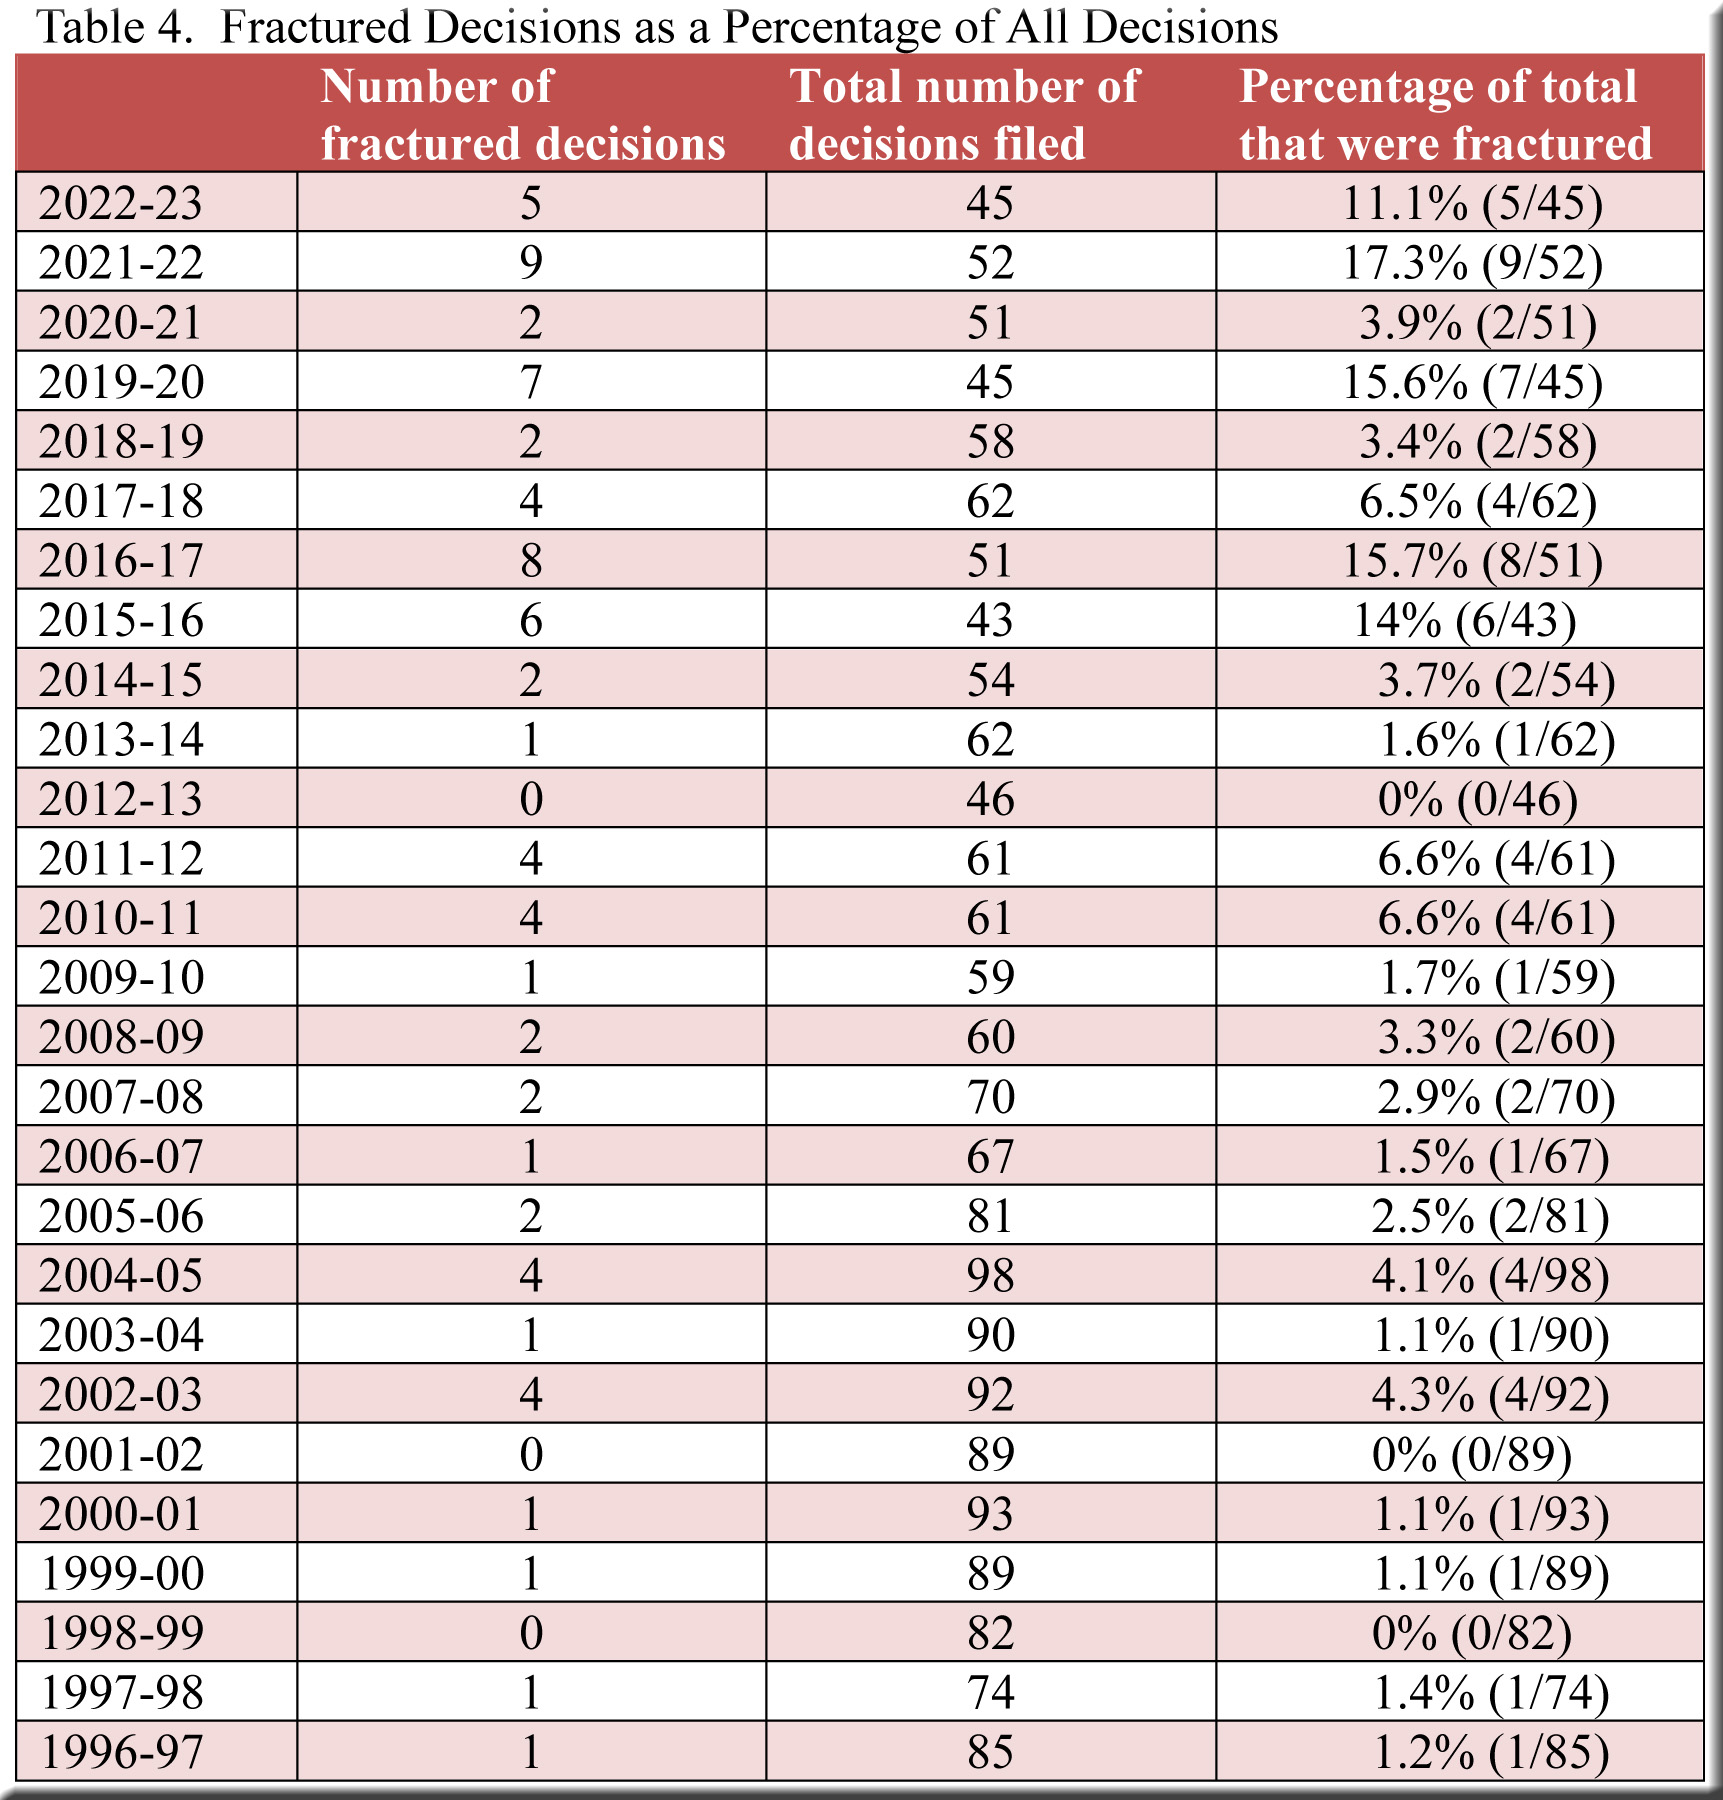
A fractured outcome results when fewer than four justices can agree on the reasoning for their decision. This deprives at least part of the decision of precedential merit, which means that it can offer little guidance to lower courts, attorneys, government officials and law enforcement. Consequently, the 2021-22 term generated cause for concern when 17.3% of the court’s decisions were fractured, an all-time high. The figure fell in 2022-23 to 11.1%, a significant decline, though still quite a substantial share, as shown in Table 4.[7] In fact, the five largest percentages, by a great deal, have all occurred in the last eight years, when the average was 10.9% per term. Compare this with the average for the prior eight terms (3.3%) and the eight terms before that (2.0%).
Looking ahead
In a week or so, I will post findings for 2022-23 that spotlight justices individually, including the rate at which they appeared in majorities, the number of their majority and separate opinions, the number of days from oral argument to the filing of each justice’s majority opinions, and the frequency (or infrequency) with which every possible pair of justices voted in agreement.
[1] The figures are for full decisions—majority opinions plus separate opinions. They include the title pages but not the blank page at the end of each decision. Per curiam decisions are omitted.
[2] The figures for majority/lead opinions do not include title pages (that is, the page or two at the beginning of a decision that lists the case title, the parties, and the attorneys). To be clear, the figures for separate opinions are not the average length of a single concurrence or dissent. They are the average number of pages per decision of concurrences and dissents combined. Per curiam decisions are omitted.
[3] Here, too, the averages do not include title pages.
[4] We are only counting separate opinions authored—not justices who joined a separate opinion written by one of their colleagues.
[5] Per curiam decisions are not included in the following graph.
[6] This increase could not have been caused by an unusually large number of separate opinions, because, as we saw in Table 3, the average number of separate opinions inched up only slightly in 2022-23.
[7] The five fractured decisions are: State v. A. G.; Matthew W. Murphy v. Columbus McKinnon Corporation; Derrick A. Sanders v. State of Wisconsin Claims Board; Secura Supreme Insurance Company v. The Estate of Daniel Keith Huck; and State v. Oscar C. Thomas.
Deadlocked (3-3) per curiam decisions are not counted as fractured in this table (though one could make a case that they should be); nor are they counted as part of the total number of decisions filed. Other (non-3-3) per curiam decisions are included in the total number of decisions.
Speak Your Mind