Today we’ll continue our assessment of the 2021-22 term with summaries of the outcomes in four areas of interest: (1) the length of decisions; (2) the number of concurrences and dissents; (3) the number of days between oral argument and decision filing; and (4) the frequency of fractured decisions.
Number of pages per decision
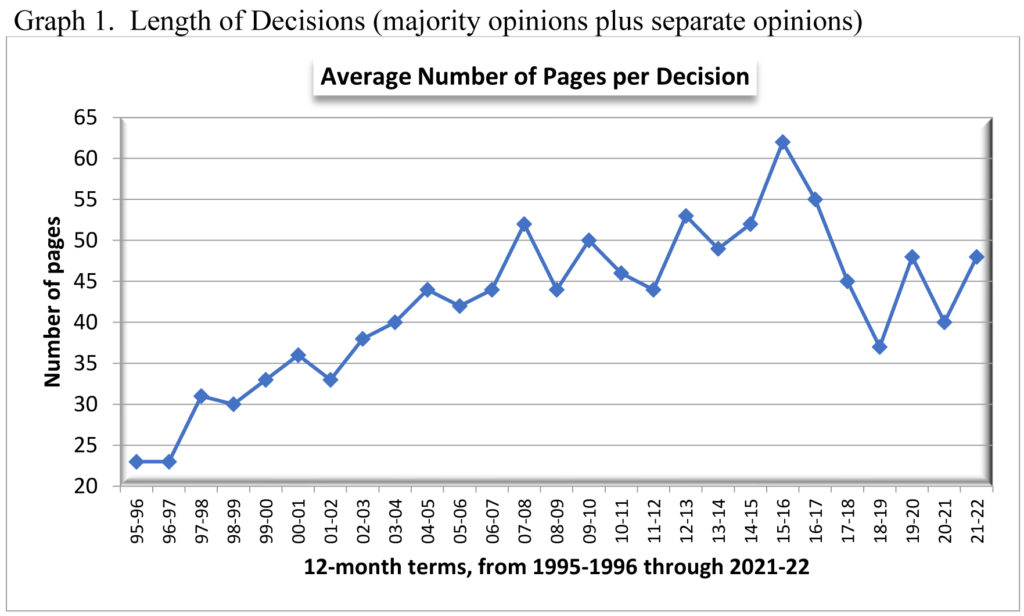
As displayed in Graph 1, the length of decisions diminished consistently, and substantially, for three years—from an average of 62 pages in 2015-16 to 37 pages in 2018-19. Thereafter the average has bounced back and forth—up to 48 pages in 2019-20, down to 40 in 2020-21, and now up again to 48 in 2021-22.[1]
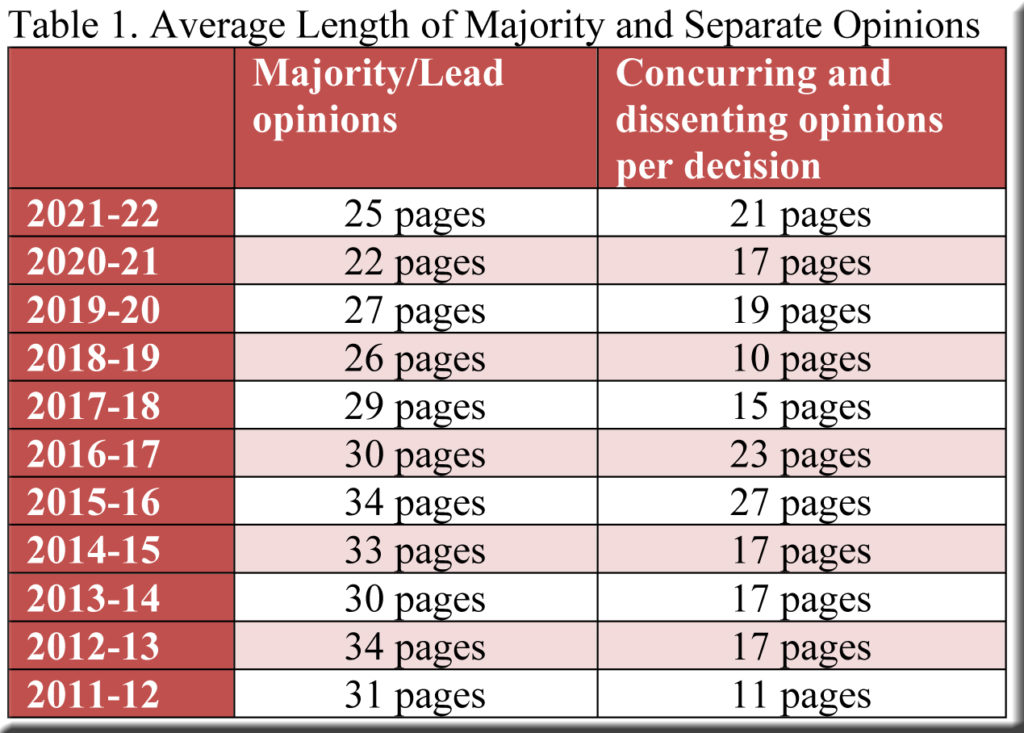
The graph’s latest uptick reflects an increase in the length of both majority opinions and separate opinions in 2021-22, just as both had declined in 2020-21 compared to 2019-20 (Table 1).[2]
Regarding the length of majority opinions, perhaps the most striking development in 2021-22 appears when we examine the averages for individual justices. The gap between the largest and smallest averages is much greater than in 2020-21, ranging from 18 pages per opinion for Justices Dallet and Hagedorn to 38 pages for Justice R.G. Bradley (Table 2).[3]
Number of concurring and dissenting opinions per decision
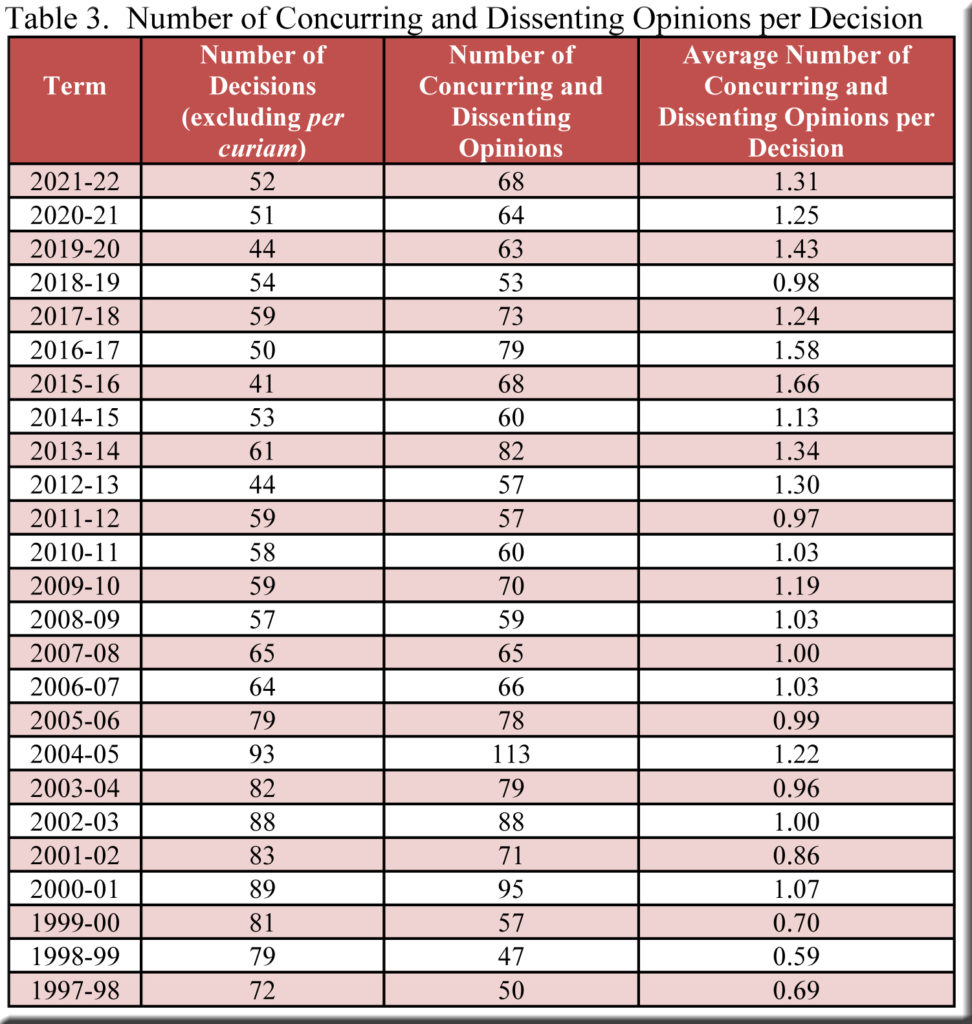
Given that the length of decisions grew in 2021-22, it’s not surprising to find that the average number of separate opinions per decision increased a bit (Table 3). Altogether there were 38 dissents and 30 concurrences, with every justice authoring more dissents than concurrences—except for Justice Hagedorn, who wrote far more concurrences (12) than dissents (2). It’s interesting to note that 10 of Justice Hagedorn’s 12 concurrences came in cases decided by 4-3 votes, and they often adhered to a structure that might be summarized as follows: “While I join the majority, it is important to explain that …”—another indication of the balancing act that he performed between the liberal and conservative blocs, detailed in previous posts.
Days to Decision
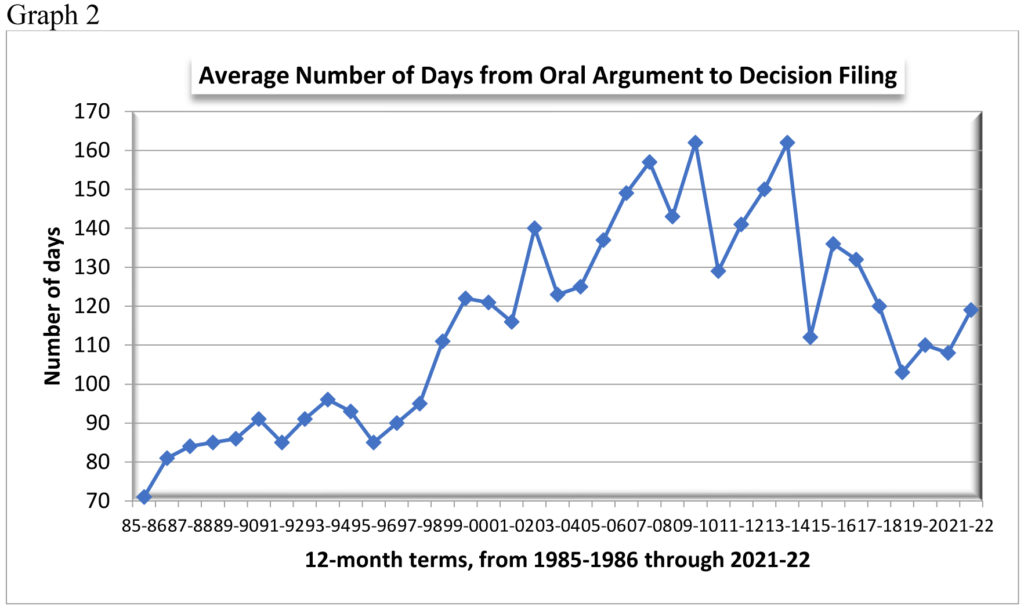
In view of the developments outlined above (longer decisions and more separate opinions), one would expect the interval between oral argument and decision filing to increase—and so it did. After dipping to 108 days in 2020-21, the average sprang back to 119 days in 2021-22, approximately its level in 2017-18 (Graph 2).[4]
Fractured Decisions
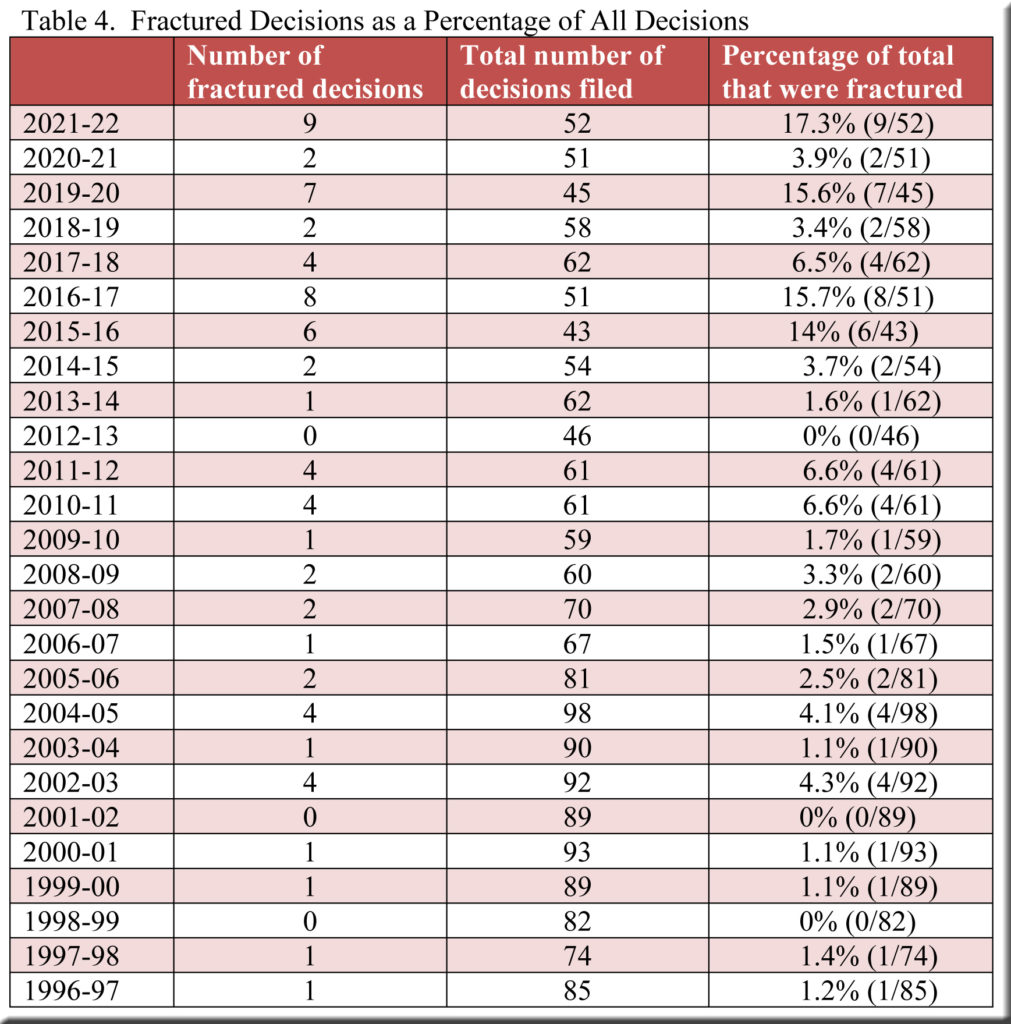
We’ll conclude with a topic of particular interest of late—the percentage of decisions that were “fractured” in 2021-22. A fractured decision occurs when fewer than four justices accept all of the reasoning for the decision, which means that at least some of the decision lacks precedential merit. When such a decision thereby fails to settle important issues, it cannot provide guidance to lower courts, attorneys, government officials and law enforcement. Given these stakes, general approval surely accompanied the plunge in the percentage of fractured decisions from 15.6% in 2019-20 to 3.9% in 2020-21, a return to levels common in previous decades (Table 4).
In 2021-22, however, the share of fractured decisions shot back up to 17.3%, the largest value for any of the 26 terms covered in the table. A glance at the figures also reveals that comparatively substantial portions of fractured decisions are a recent phenomenon—with the four highest percentages concentrated in the last seven years, when the average annual percentage of fractured decisions was 10.9%. In contrast, the average for the preceding 19 terms (1996-97 through 2014-15) was 2.4%, with no individual term surpassing 6.6%.
[1] The figures are for full decisions—majority opinions plus separate opinions. They include the title pages but not the blank page or two at the end of each decision. (Nor do they include the two pages of appendices in State v. Valiant M.Green.)
[2] The figures for majority/lead opinions do not include title pages (that is, the page or two at the beginning of a decision that lists the case title, the parties, and the attorneys). To be clear, the figures for separate opinions are not the average length of a single concurrence or dissent. They are the average number of pages per decision of concurrences and dissents combined.
[3] Click here for a table comparing all justices for the period 2015-16 through 2021-22.
[4] The figure for 2021-22 does not include one case submitted on briefs (Billie Johnson v. Wisconsin Elections Commission [November 30, 2021]).

Speak Your Mind