Following a recent post’s observation that an unusually large share of cases coming before the supreme court during the current term are per curiam decisions from the court of appeals, a reader wondered if a significantly higher percentage of all court of appeals opinions had been per curiam decisions in 2014-15—which might help explain why the supreme court’s calendar contains a larger proportion of per curiam decisions than in the past. The concern stems from the nature of per curiam opinions, which are unsigned rulings reserved for cases of lesser significance—those not presenting “new or unsettled questions of general importance.” Indeed, they may not even be cited as persuasive authority.[1]
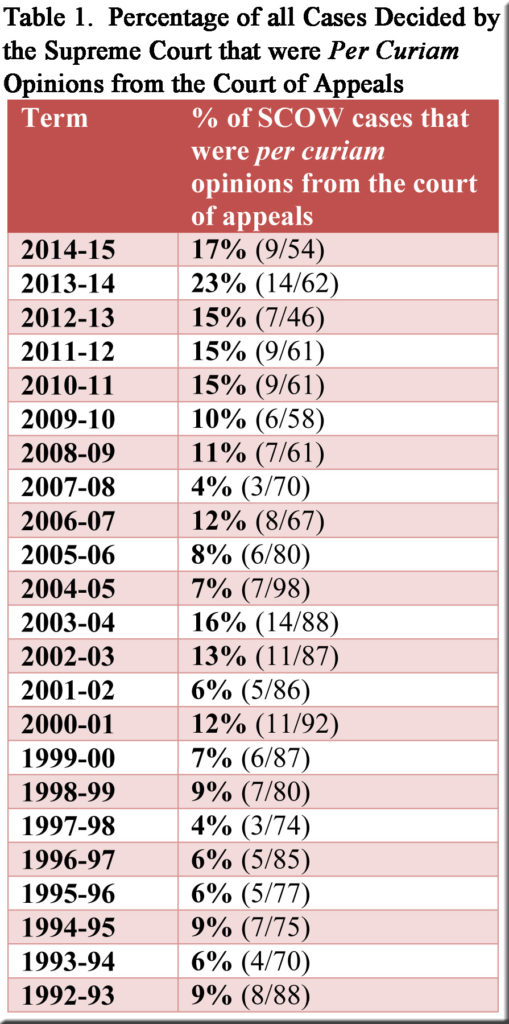
We’ll begin by determining the percentage of all cases decided by the supreme court that had arrived as per curiam decisions from the court of appeals. The results (displayed in Table 1 for the terms currently covered by SCOWstats) indicate that the percentage has been considerably higher in recent years than in the early years of the period—never exceeding 9% in the 1990s and never falling below 15% since 2010-11 (with the figure for 2015-16 predicted to rise as high as 26%).
(click on the tables to enlarge them)
To be sure, the upward trend disappears in the middle of the table, but the overall increase of the percentages is unmistakable. The average of the percentages for the period 2010-11 through 2014-15 (17%) is nearly two and a half times the average for the five terms from 1992-93 through 1996-97 (7%).
However, the presence of a long-term trend in Table 1 is not essential to the question posed by the reader: Is there a relationship between (1) the percentage of supreme court cases that reached the justices as per curiam opinions from the court of appeals and (2) the percentage of all court of appeals opinions that were per curiam? A relationship could exist whether or not the data in Table 1 exhibit any tendency on their own.
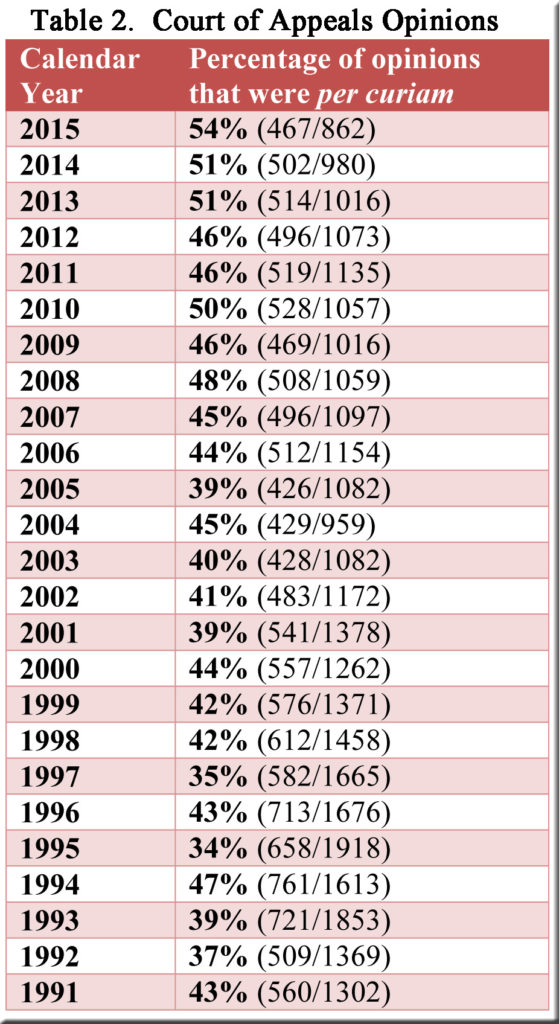
Consider Table 2, which provides Lexis data[2] on the percentage of court of appeals opinions that were per curiam. Readers may be struck most of all by the dramatic (even stunning) reduction in the total number of opinions issued by the court of appeals over the 25-year period. From a high of 1918 opinions in 1995, the total plunged to 862 in 2015—a drop of over 50%. The decline has been so steep that it merits consideration here along with the table’s percentages specifying the share of opinions each year that were per curiam decisions.
A look at the two tables suggests some correlation between the figures that they contain, mainly for the most recent years when the percentages in both tables reached their high points. Although cause and effect should not be asserted on this basis, the information in the two tables furnishes a degree of encouragement for the hypothesis that a shrinking pool of signed opinions from the court of appeals helps explain why more of the supreme court’s catch has come from the pool containing per curiam decisions during the past few years.
That said, the correlation between the percentages in the two tables does not continue throughout, especially during the 1990s, when per curiam decisions from the court of appeals occupied a much smaller portion of the supreme court’s schedule. There is no equivalent drop for the 1990s in the percentage of all court of appeals opinions that were per curiam (Table 2). If pressed to fit the figures for the 1990s into the reader’s hypothesis, one might speculate that the court of appeals was issuing so many opinions in the 1990s that even a fairly substantial percentage of per curiam decisions left a sufficiently large remainder of suitable signed opinions to fill most of the supreme court’s calendar.
In conclusion, the information above suggests that the stated hypothesis may have merit—notably for the supreme court’s recent terms, which represent the period of interest to the reader who kindly submitted the topic for consideration. Perhaps the number of signed opinions from the court of appeals has shrunk to the point where the supreme court feels compelled to cast its net more frequently into the per curiam pool. If, at the same time, internal issues have left the justices scrambling of late to fill an underpopulated calendar with additional cases—including dubious ones of per curiam pedigree, as Justice Abrahamson regretted last year—these internal issues could be combined with the reader’s hypothesis to help explain the high percentages at the top of Table 1. As always, I would be grateful to learn of additional factors that may account for the figures in Table 1 (and, for that matter, the trends in Table 2).
[1] Michael S. Heffernan, Appellate Practice and Procedure in Wisconsin, 6th ed. (Madison, WI: State Bar of Wisconsin, 2014), §17.4 and §21.19.
[2] The Lexis data in Table 2 include opinions but not terminations that took other forms, such as dismissals, summary dispositions, and the like.


As of July 1, 2009 unpublished court of appeals authored opinions could be cited for persuasive value. Wis. Stat. § 809.23(3)(a). This may account for a change to more per curiams since that time.
Thanks much for the comment. It would certainly appear that the change you identified could be included as part of a plausible explanation for the developments noted in the post.